Difference between revisions of "Diagnostics - Active Information"
From VersaVision Support
| Line 1: | Line 1: | ||
<BR> | |||
<span style="box-shadow:2px 2px 15px #90A4AE; border-radius:5px; padding:20px">[[File:Active-Button-No.png|250px|link=Diagnostics - Active Information]]</span> | |||
<div style="text-align: center;"><span style="color:#0054a6; font-size:150%;"><u>'''OVERVIEW'''</u></span></div> | <div style="text-align: center;"><span style="color:#0054a6; font-size:150%;"><u>'''OVERVIEW'''</u></span></div> | ||
<BR> | <BR> | ||
Latest revision as of 11:59, 11 August 2023
![]()
Diagnostics is a section of the software where the user can view all the active monitoring points and log files related to system function.
Active Information is a real-time display of all active monitoring points of any module being used.
This page will concentrate on explaining how a user can view and interact with the page/information.
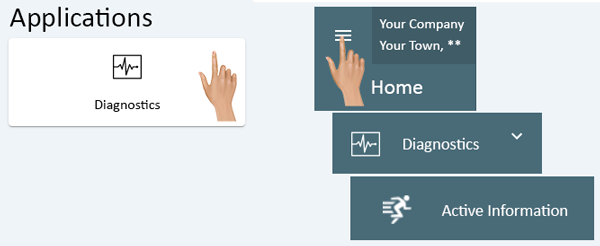
Diagnostics can be accessed via the Home page menu or the Diagnostics icon under Applications. Once the Diagnostics has been selected - select Active Information from the menu.
|
|
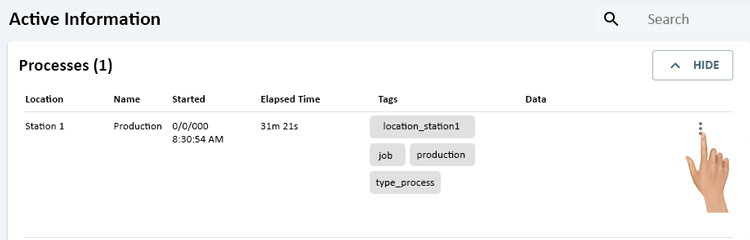
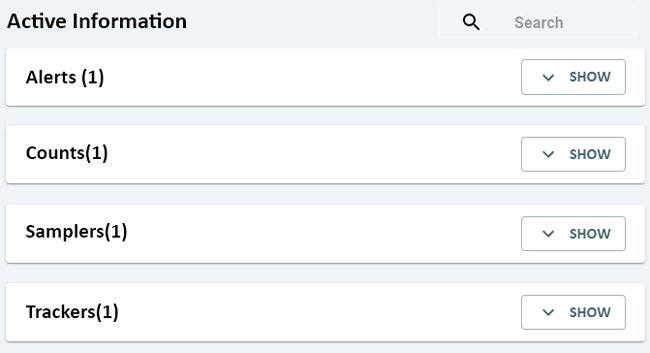
On the Active Information page there will be separate sections for each monitoring point type.
If there is nothing active for a monitoring point type, the section will not show on the screen.
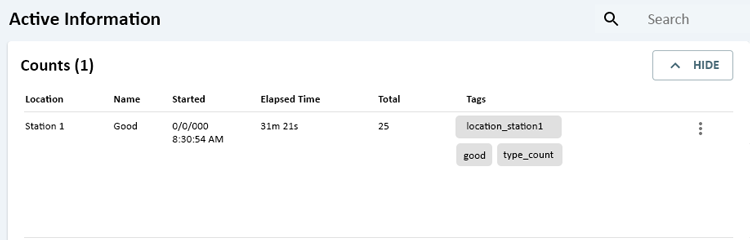
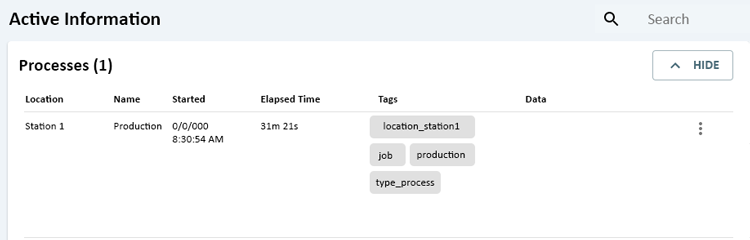
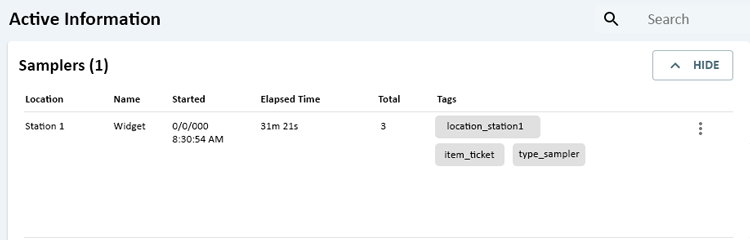
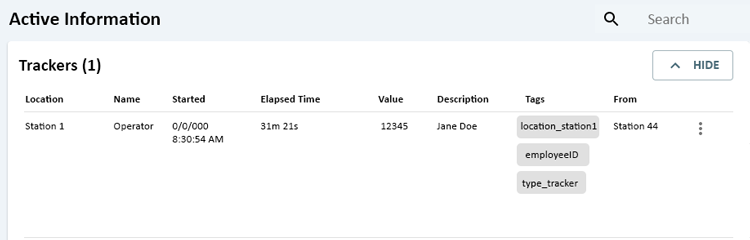
There are a total of 5 different monitoring point types: Alerts, Counts, Processes, Samplers & Trackers.
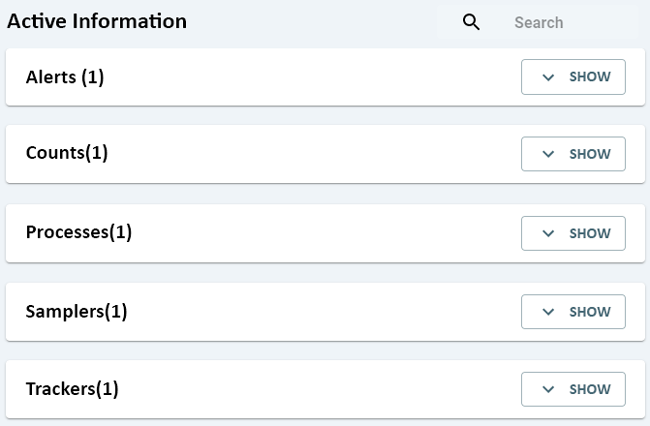
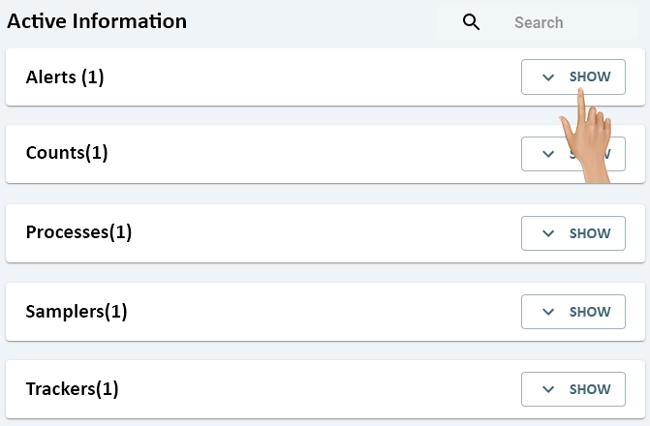
To View everything that is active for a specific monitoring point, click on the Show button.
Below are examples of each Monitoring Point Type.
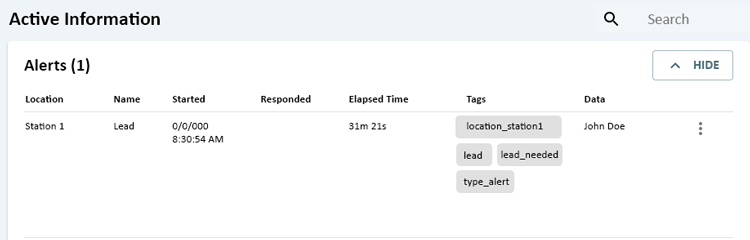
To manually clear an active monitoring point, click on the 3 dot menu.
Select Forcibly Clear from the pop-up menu.
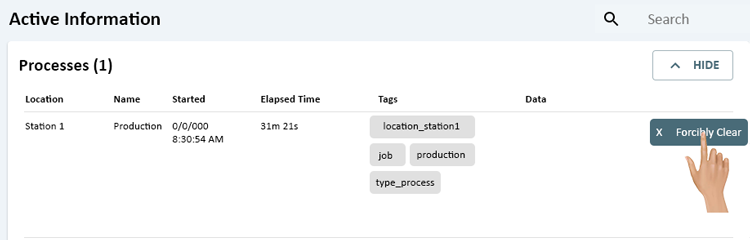
The Monitoring point will be removed for Active Information. The monitoring point will also be Cleared on the Module.
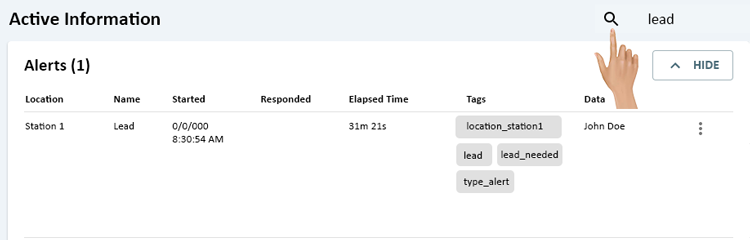
Use the Search field to find a specific monitoring point. Type in a keyword, the list of monitoring points will filter automatically.
|
|

|