Diagnostics - Logs
From VersaVision Support
![]()
Diagnostics is a section of the software where the user can view all the active monitoring points and log files related to system function.
Logs is where information is recorded about everything running on the system. These logs can be informational or contain error data.
This page will concentrate on explaining how a user can view and interact with the logs.
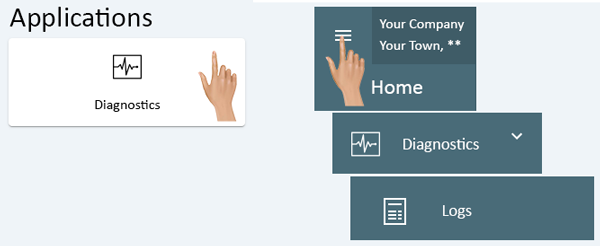
Diagnostics can be accessed via the Home page menu or the Diagnostics icon under Applications. Once the Diagnostics has been selected - select Logs from the menu.
|
|
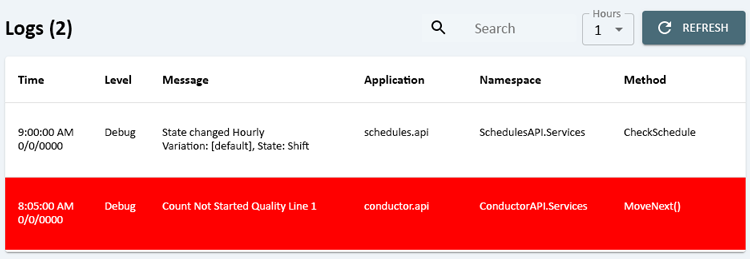
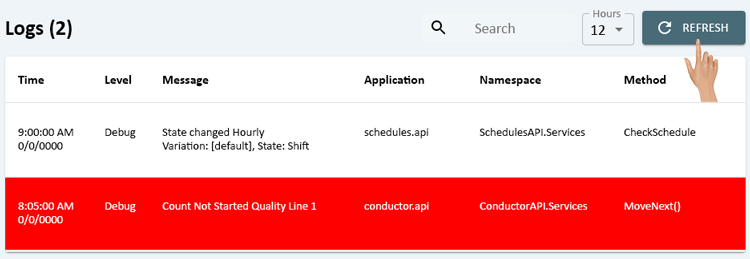
On the Logs page page the logs are presented in a table type of format.
Informational Logs will appear with a white background and black text.
Error Logs will appear with a red background and white text.
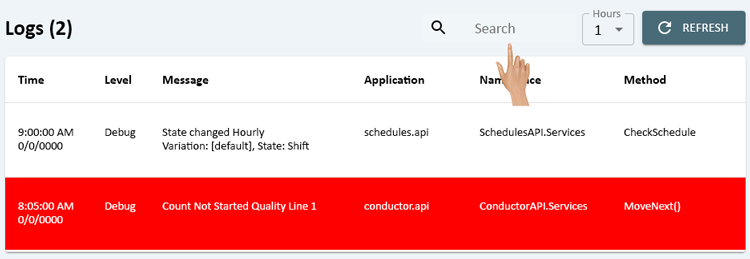
Use the Search field to find specific logs by entering a keyword(s).
Click on the down arrow in the Hours field to select a range.
The system will allow the user to go back 1, 4, 8, 12 or 24 hours.
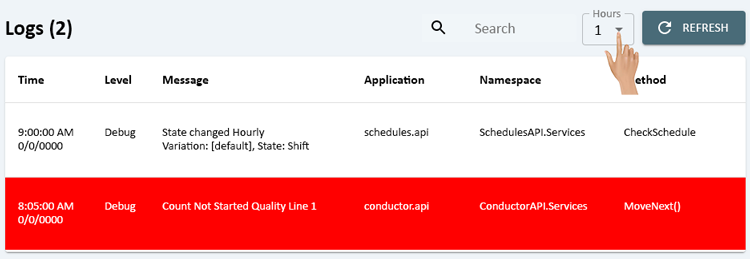
After selecting a time, click on the Refresh button to load all of the logs within that time frame..
|
|

|