Mixed - Moving Average - Series
From VersaVision Support
Reporting is where the user can generate reports based on the data collected by the VersaVision software. There are multiple components inside Reporting, this page is focused on the Series - Moving Average component for a Mixed Type report cell.
A series is a way to define data to be used on a Bar, Line or Area of the report. The Moving Average type allows the user to take a Series total and Average it out over multiple days, weeks or months.
A good example of the use of a Moving Average would be to see the Average Downtime for the Week.
NOTE: In order to create or use a Moving Average Series, the user must setup the Data Series first. Using the example above, the Total Downtime Series would have to created first.
This page will concentrate on providing details on Adding, Editing, Duplicating, Deleting, Moving or Expanding a Data Series from a Mixed Report Cell.
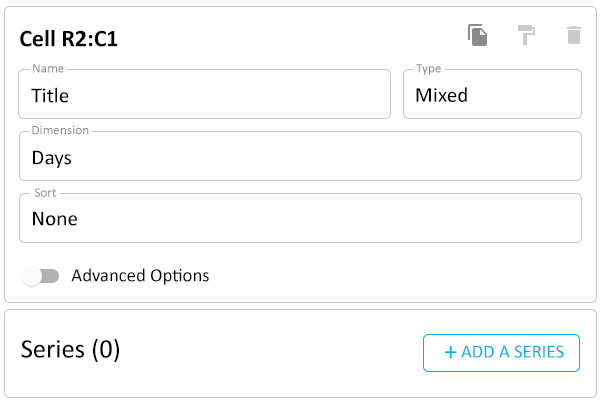
When a Report Cell has been selected on the layout and it is setup as a Mixed type, the Series field will be visible on the right side of the layout under the Cell heading
All sections available under this heading are addressed in the information on this page.
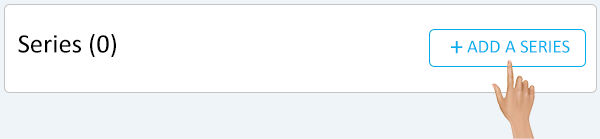
Select a Cell in the Report Layout. Click on the Add a Series button under the Series heading.
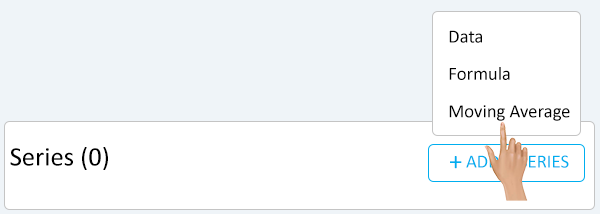
A pop-up menu will load above the Add a Series button - select Moving Average from the menu.
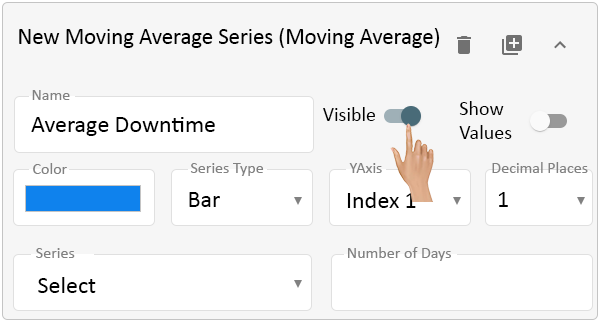
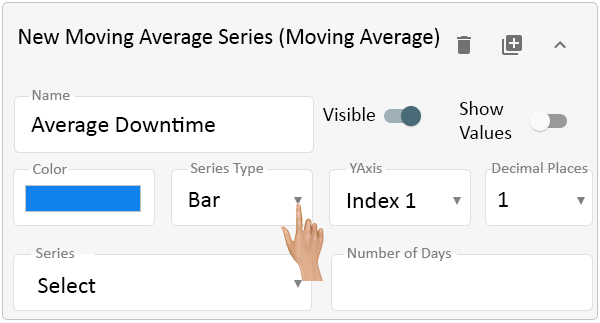
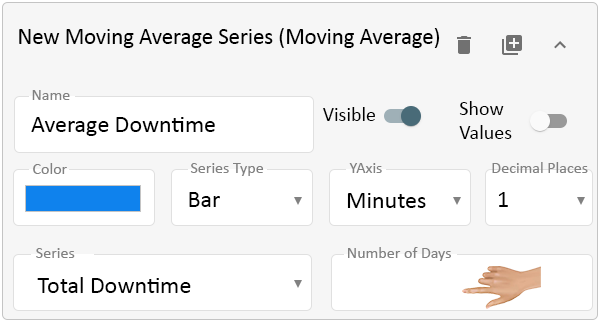
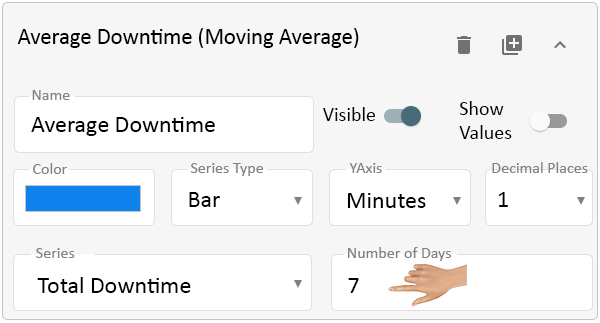
The Series Properties will load. Click in the Name field to enter a name for the series.
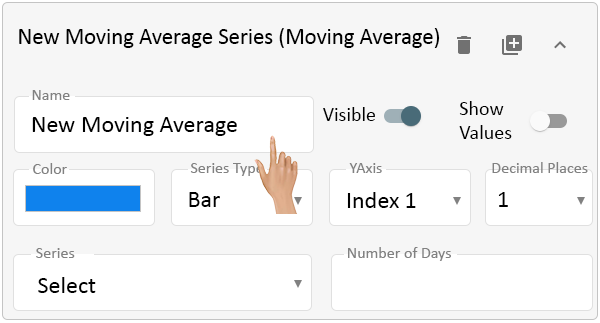
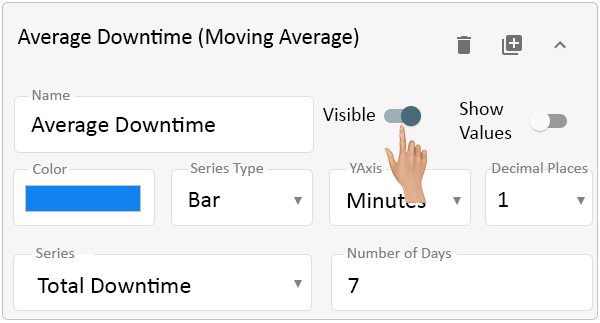
By default, the Visible switch will be ON. This indicates that the Moving Average Series being created will show on the report. Select the best option for the report being created.
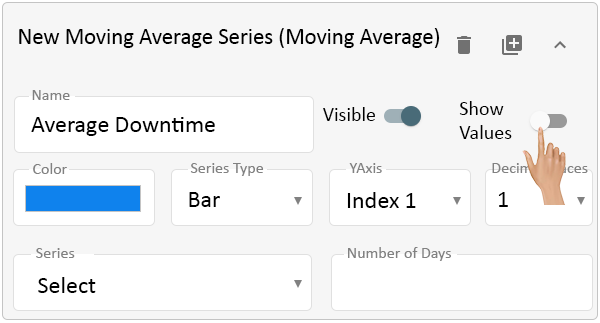
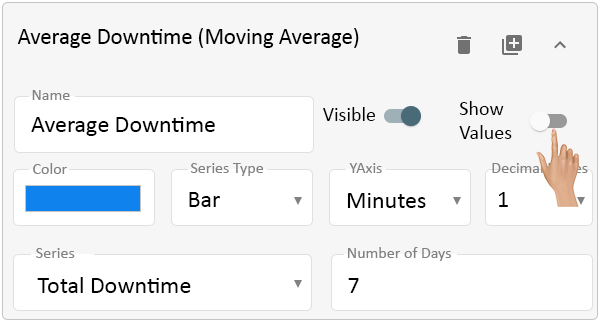
By default, the Show Values option will be OFF. Turning the option ON will display the Moving Average Result on the Bar, Line or Area of the report.
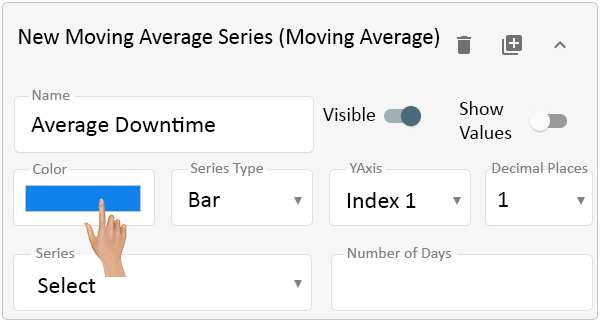
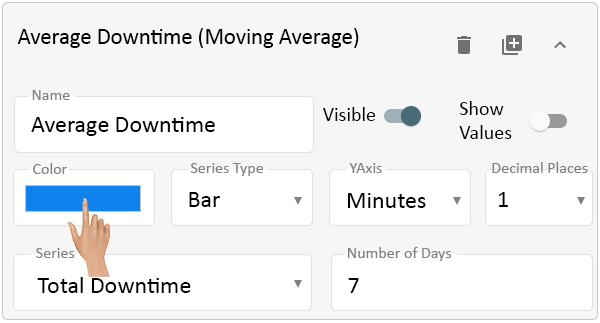
Click on the swatch in the Color field.
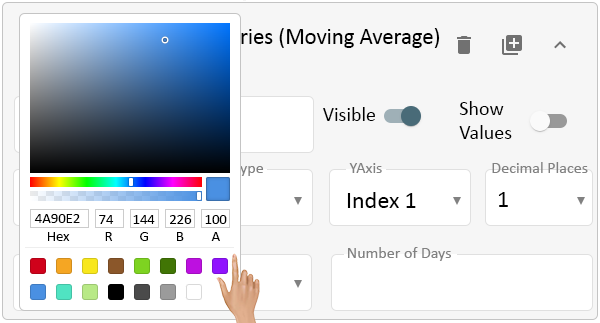
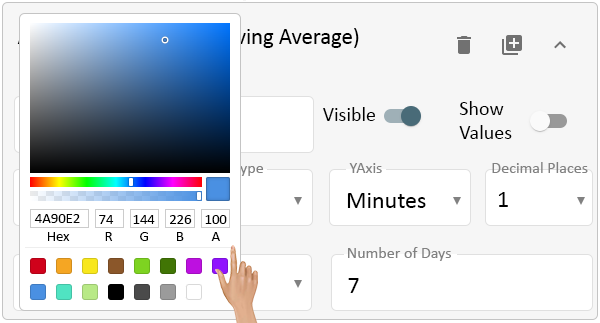
A color picker interface will load on the screen. Pick a preset color or mix a custom color.
The color selected will be the Bar, Line or Area color on the report.
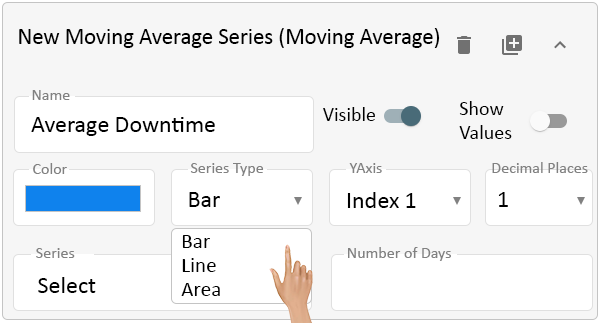
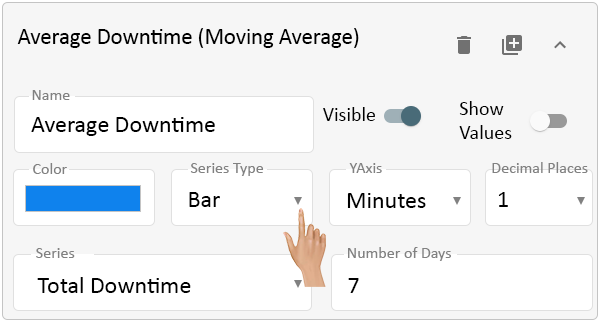
Click on the down arrow on the Series Type field. This is where the user will define how the Moving Average Result will appear on the report (Bar, Line or Area).
On the drop down list select an option.
- Bar - this will represent the result on the report as a bar.
- Line - this will represent the result on the report as a horizontal line.
- Area - this will represent the result on the report as a wave.
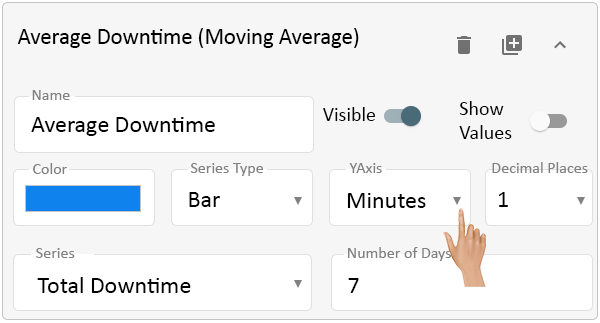
Click on the Y-axis arrow to see the available list.
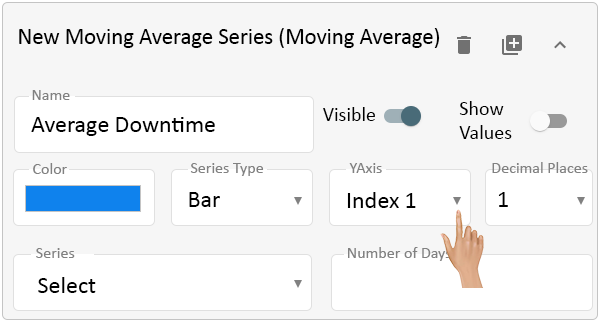
The Y-axis is defined in the Appearance section. There are 2 Y-axes available - Right & Left.
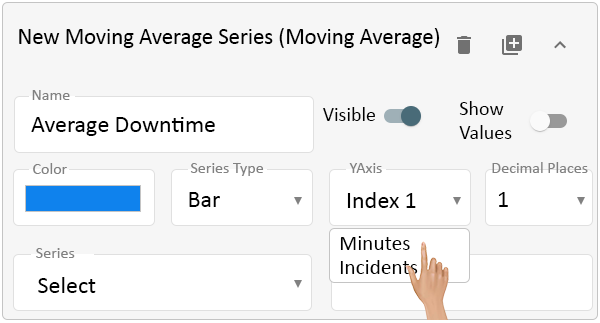
Select which Index (Axis) the Moving Average Series is to be associated with. By default the system will show Index 1 & Index 2 until they have been defined/named in the Appearance section.
- Example: User creates a Mixed Average Series for Total Downtime. The user would select Minutes as it would be an average number of minutes.
Select the appropriate Axis Name for the Series being created.
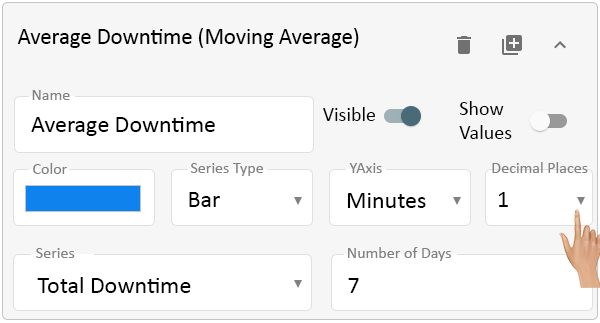
Click on the Decimal Places arrow to see the available list and change the setting. By default, 1 will be selected.
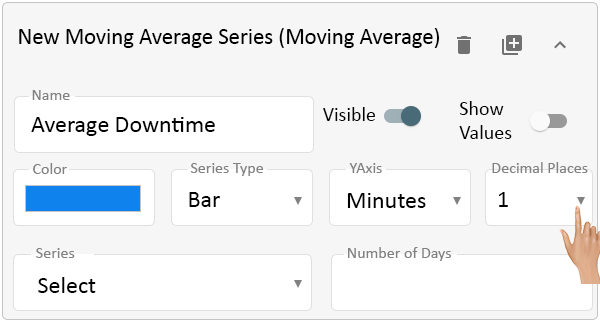
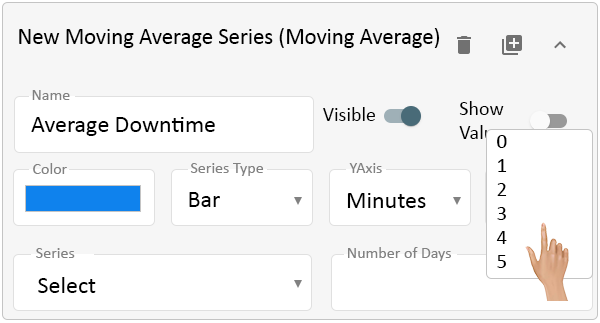
The list will show 0 to 5. If the Moving Average Result needs to show a specific number of decimal places on the graph, select a 1, 2, 3, 4 or 5. If the Moving Average Result should only show a whole number, select 0.
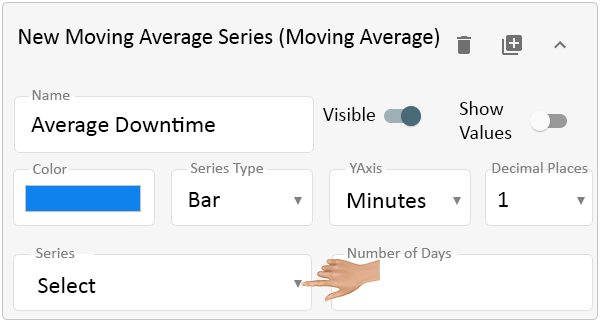
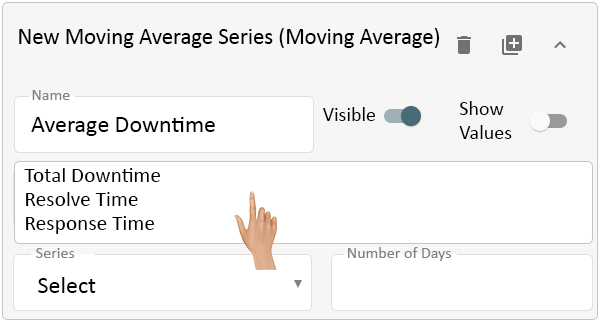
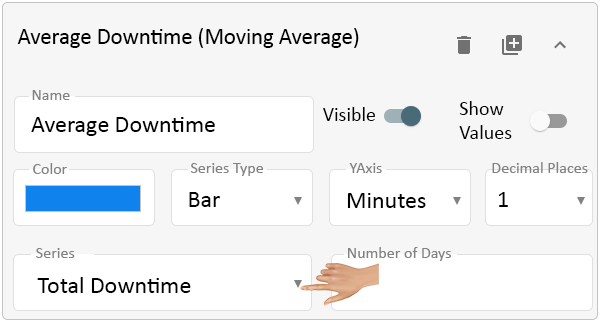
Click on the down arrow in the Series field. Depending on the setup of the report, there may be multiple Series available to select from. Select the appropriate Series for the report being created
Using the example of Average Downtime, the Total Downtime Series would be selected.
Using the example of Average Downtime, the Total Downtime Series would be selected.
Click on the Number of field. The field Name will switch depending on what Dimension is selected in Cell Properties. Enter the appropriate number for the report being created.
- The Dimension field has the following selections that may show in this field - Months, Weeks, Days, Location, Name, Reason, Tag Filters and Shift Tag Filters. The most common selection would be Months, Weeks or Days.
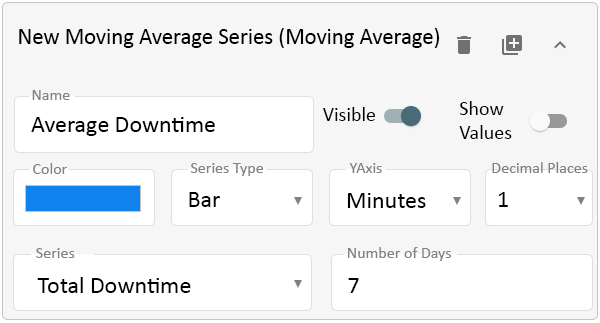
Using the example of Average Downtime, the Dimension is set to Days. This example is based on a 7 day work week, so the Number of Days is 7.
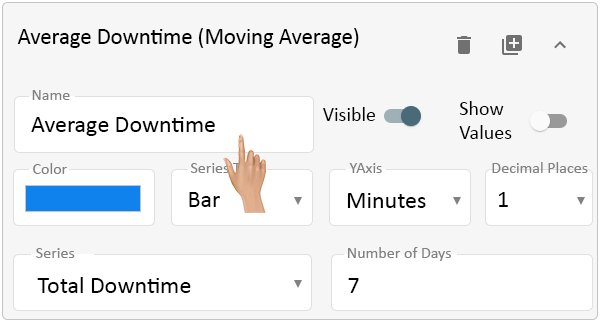
Click on the Expand icon to open the Series Properties.
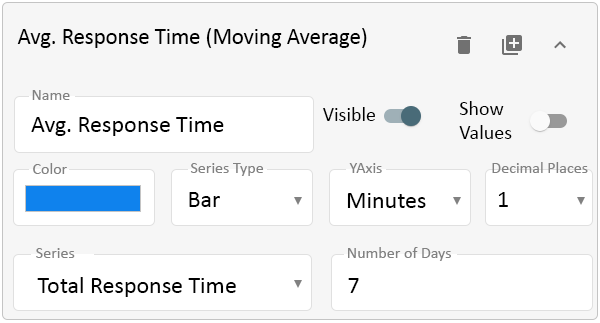
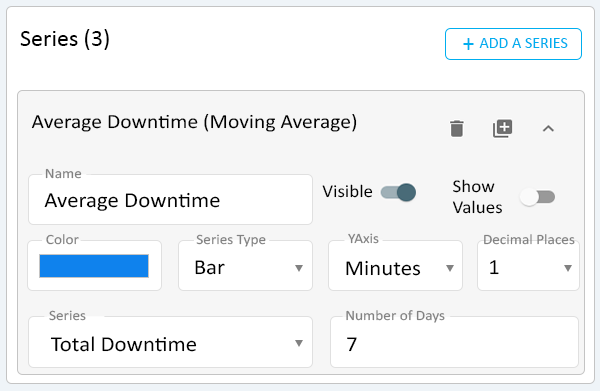
The Series Properties will show. Click in the Name field to change the name of the series.
Click on the Visible toggle to either show the Moving Average Result or not to show it.
Click on the Show Values toggle to either show the Moving Average Result on the report cell or not show it.
Click on the swatch in the Color field to change the color of the Moving Average Result Bar, Line or Area.
A color picker interface will load on the screen. Pick a preset color or mix a custom color.
Click on the down arrow on the Series Type field to change the current graphic type (Bar, Line or Area).
On the drop down list select the appropriate option.
- Bar - this will represent the result on the report as a bar.
- Line - this will represent the result on the report as a horizontal line.
- Area - this will represent the result on the report as a wave.
Click on the Y-axis arrow to see the available list.
The Y-axis is defined in the Appearance section. There are 2 Y-axes available - Right & Left.
Select which Index (Axis) the Moving Average Series is to be associated with.
Click on the Decimal Places field to change what is displayed for the Moving Average Result.
The list will show 0 to 5. If the Formula being created needs to show a specific number of decimal places on the graph, select a 1, 2, 3, 4 or 5. If the Formula Result should only show a whole number, select 0.
Click on the down arrow in the Series field to select a different series to be averaged.
Click on the Number of field to change the dimension range.
- The Dimension field has the following selections that may show in this field - Months, Weeks, Days, Location, Name, Reason, Tag Filters and Shift Tag Filters. The most common selection would be Months, Weeks or Days.
Once a Series has been setup, it can be Duplicated. Click on the Duplicate icon for the series that needs to be duplicated.
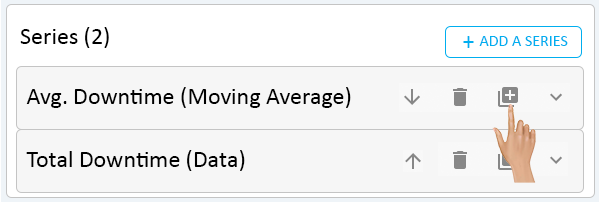
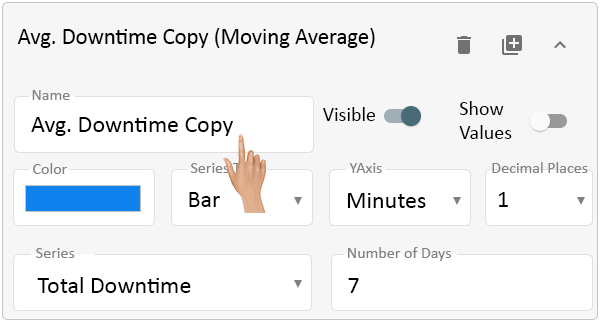
The duplicated series will show at the bottom of the Series list as "(Name) Copy".
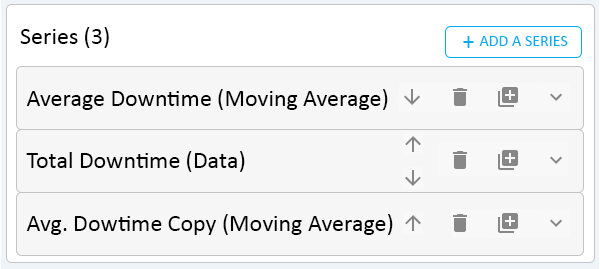
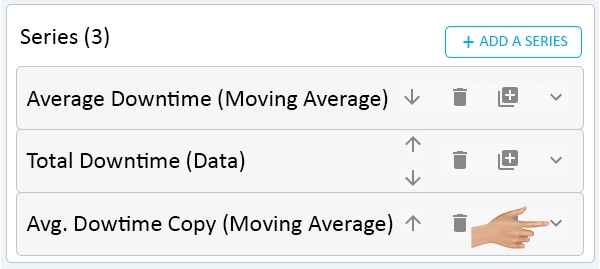
Click on the Expand icon for the duplicated series.
Click in the Name field to enter the correct name.
Edit any of the other fields that need to be changed.
Refer to the "Edit a Series" section about for details on altering the fields - Click Here.
Once a Series has been setup, it can be removed from the report. Click on the Delete icon for the Series that needs to be removed.
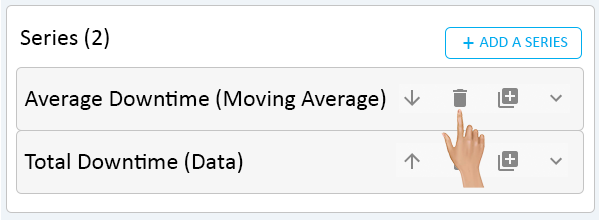
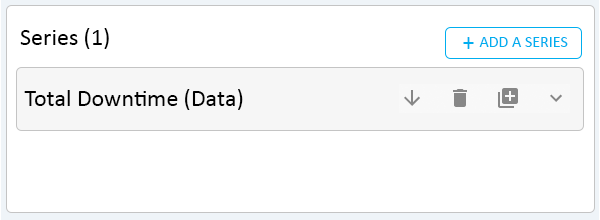
There will be no warning message, the Series will be automatically removed.
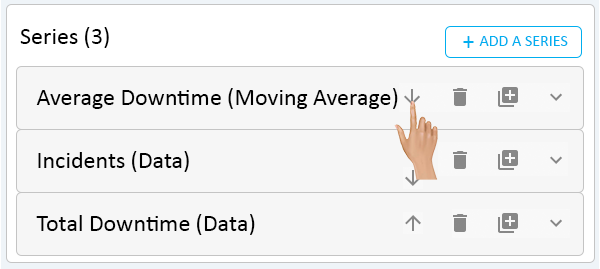
When there are multiple Series in a report, the user can change the order.
If the Series is set to be Visible, the order will change where the Bar, Line or Area is on the report cell.
For a Series at the Top of the order, click on the Down icon to move it down in the order.
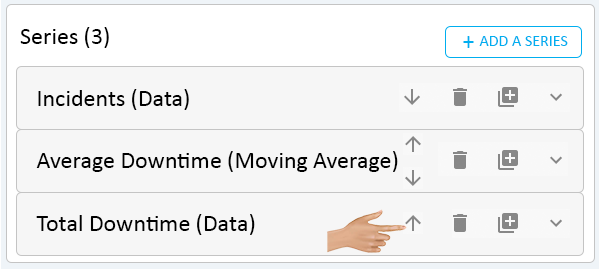
For a Series at the Bottom of the order, click on the Up icon to move it up in the order.
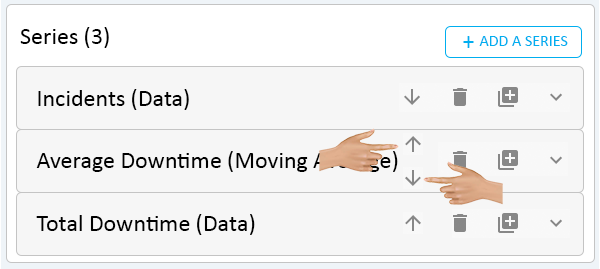
For a Series in the Middle of the order, click on the Up or Down icon to move it up or down in the order.
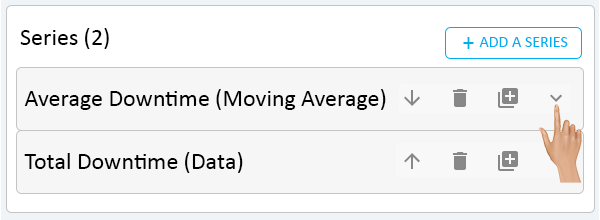
When there are multiple Series in a report, only the active/selected Series will show. To change between series the user will need to open/expand the closed series.
Click on the Expand icon.
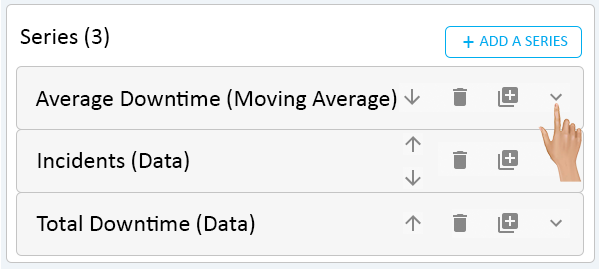
The Series selected will open/expand to show the details. Any Series that was previously opened/expanded will automatically collapse.

|