Reporting - Reports
From VersaVision Support
![]()
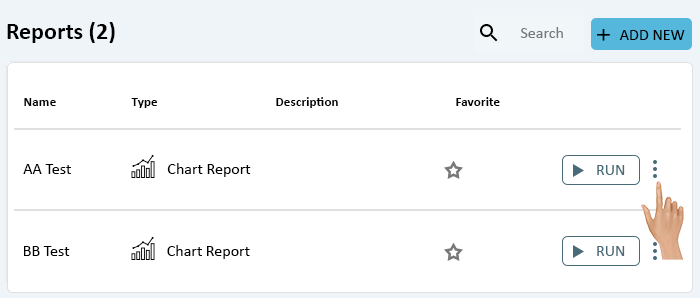
Reporting is where the user can generate reports based on the data collected by the VersaVision software. There are multiple components inside Reporting, this page is focused on the Reports component.
The information below will explain all the features and options available. This page will NOT explain how to create a report. Please see how to articles for information regarding report creation.
This page will concentrate on Adding a Report (Basics) not report creation, Editing (Basics), Duplicating, Deleting, Running and Favoriting.
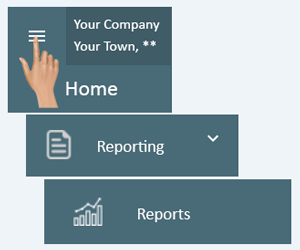
Reporting can be accessed via the Home page menu by expanding Reporting. Once Reporting has been opened - select Reports from the menu.
|
|
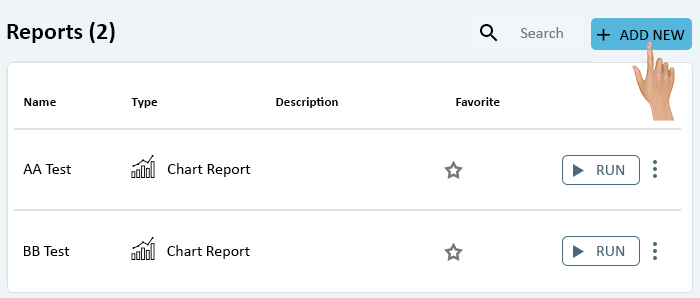
To Add a Report, click on the Add New button in the top right corner of the page.
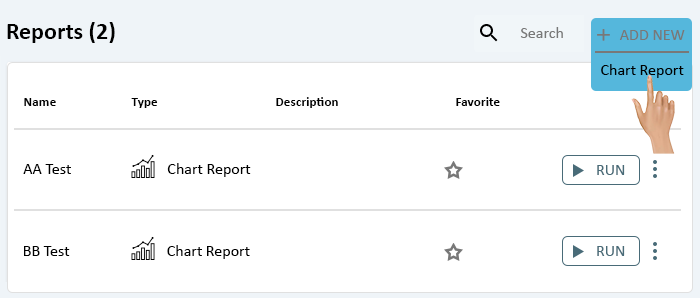
Select Chart Report from the drop down menu.
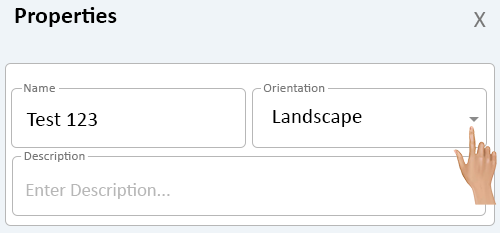
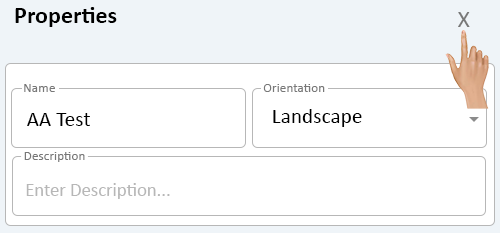
On the Properties window, click in the Name field and enter a name for the report.
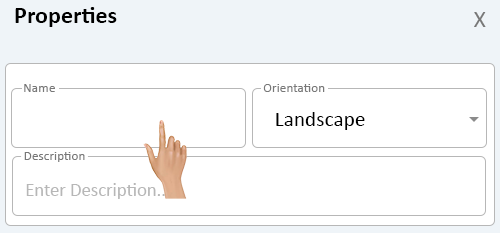
Click on the down arrow in the Orientation field to select either Landscape or Portrait positioning.
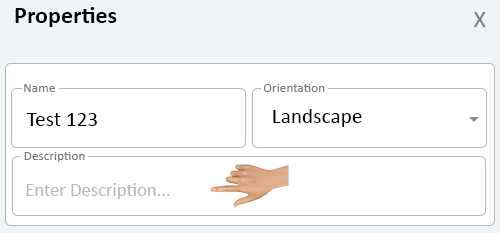
Click in the Description field to enter a description of the report.
VersaCall suggests that a description be entered. The description will show on the reports list and make it easier to find a specific report when there are many.
Click on the "X" in the top right corner of the window to close the Properties window.

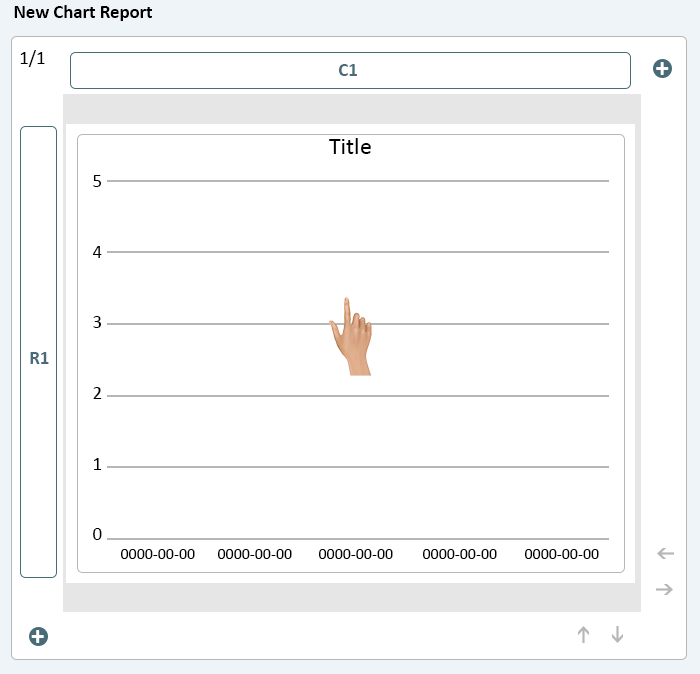
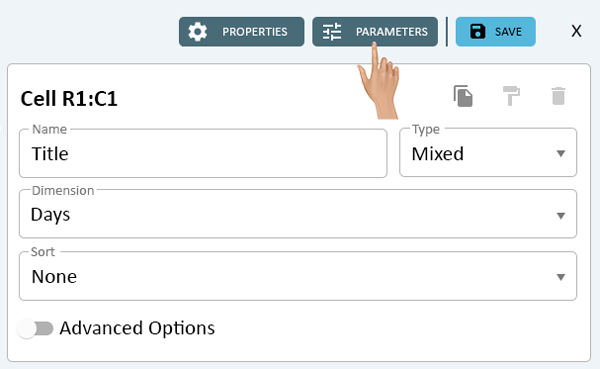
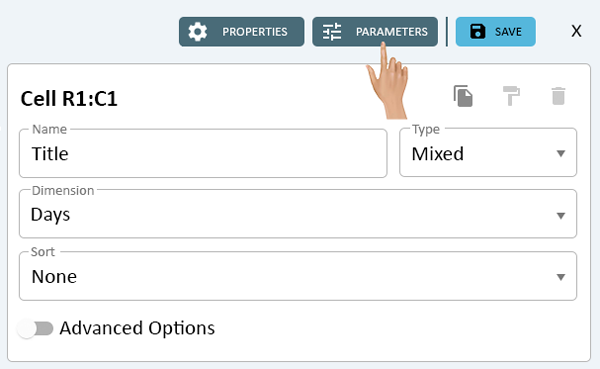
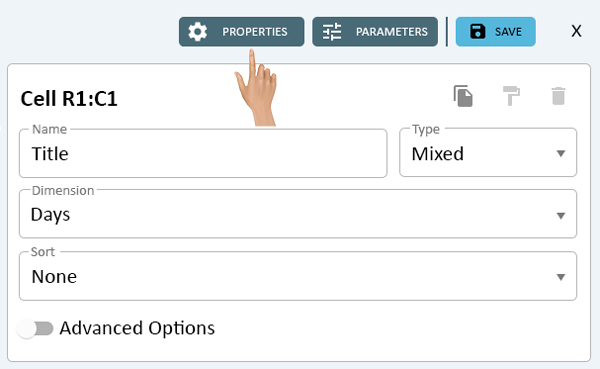
A report cell will be visible on the layout. Click on this cell to access the properties.
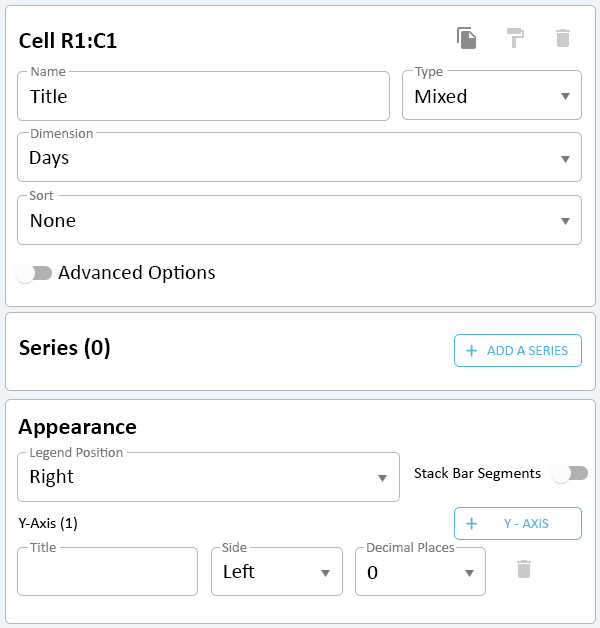
On the right side of the layout the Cell Properties will load. There are 3 sections available.
- Cell Property - section at the top where the overall functionality of the cell is setup.
- Click Here for details on this section.
- Series - section in the middle that contains each data segment of the Chart/Graph. Depending on the Cell Type that is selected, there are multiple options that can be available in series.
- Mixed
- Click Here for details on the Mixed - Data Series.
- Click Here for details on the Mixed - Formula Series.
- Click Here for details on the Mixed - Moving Average Series.
- Pie Chart
- Click Here for details on the Pie Chart - Data Series.
- Click Here for details on the Pie Chart - Formula Series.
- Click Here for details on the Pie Chart - Moving Average Series.
- Dynamic - this is custom report option, please contact VersaCall support for assistance.
- Blank - when this type of cell is setup there will not be a Series option.
- Mixed
- Appearance - section at the bottom that contains the layout of the Chart/Graph when the Cell Type is Mixed or Pie Chart. There will not be any options when the Cell is setup as Dynamic or Blank. The Appearance for a Mixed Chart differs from a Pie Chart, select the appropriate link below.
- Click Here for details on a Mixed Chart/Graph Appearance.
- Click Here for details on Pie Chart Appearance.
- Cell Property - section at the top where the overall functionality of the cell is setup.
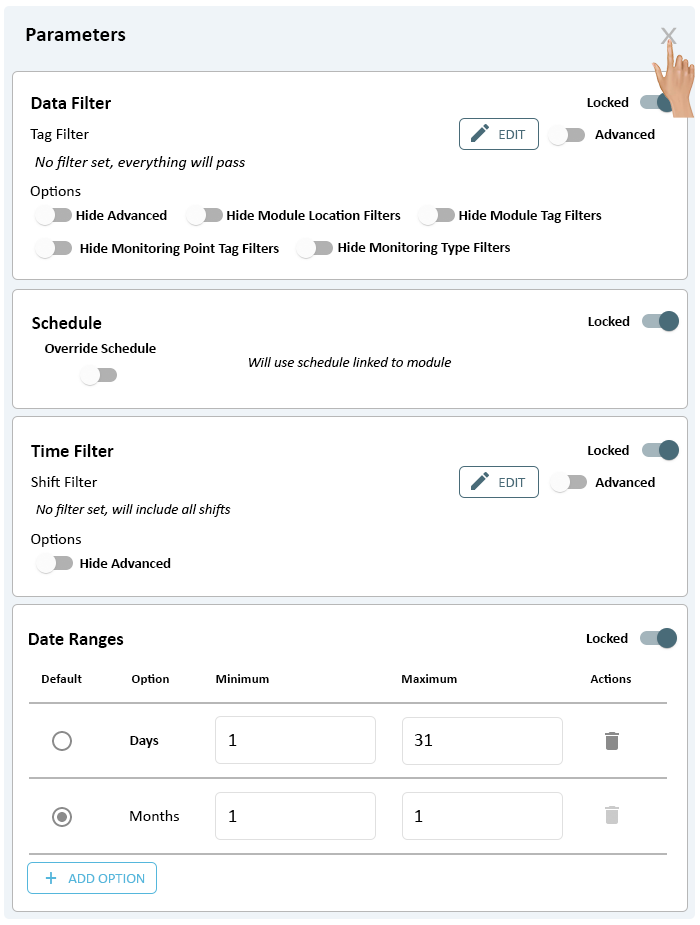
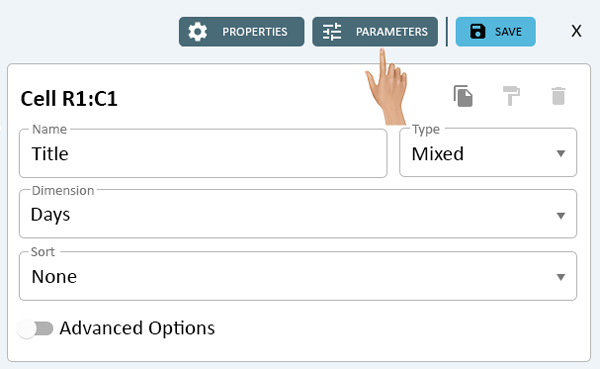
To access the Parameters of a report, click on the Parameter button at the top of the page next to the Save button.
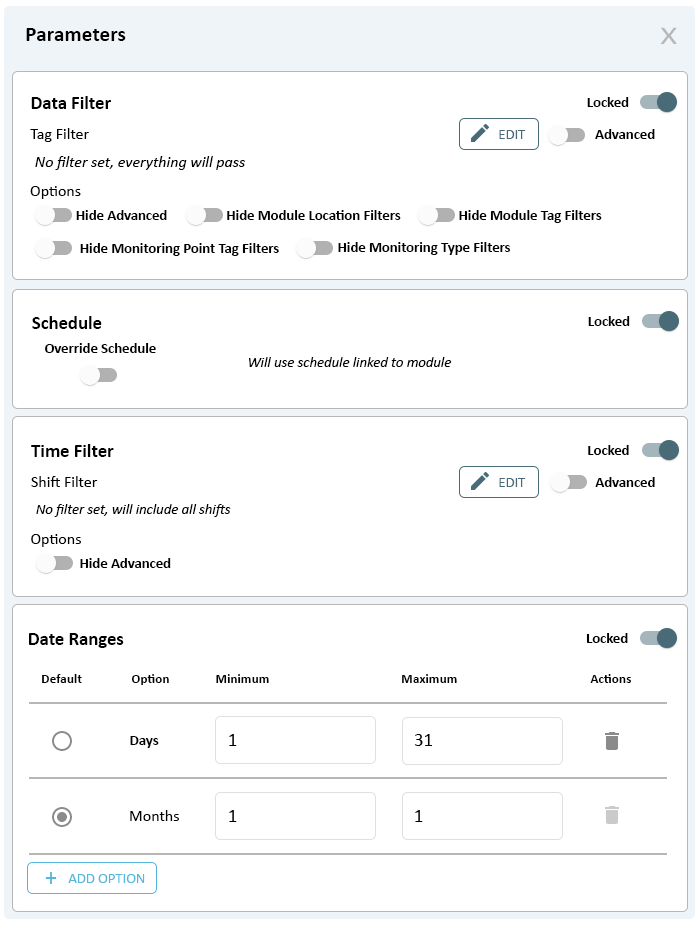
Parameters are used to either lock options or allow the user to select options when running a report. There are 4 sections/options in Parameters.
- Data Filter - Click Here for details on setting up this option.
- Schedule - Click Here for details on setting up this option.
- Time Filter - Click Here for details on setting up this option.
- Date Ranges - Click Here for details on setting up this option.

To close the Parameters window, click on the "X" in the top right corner.
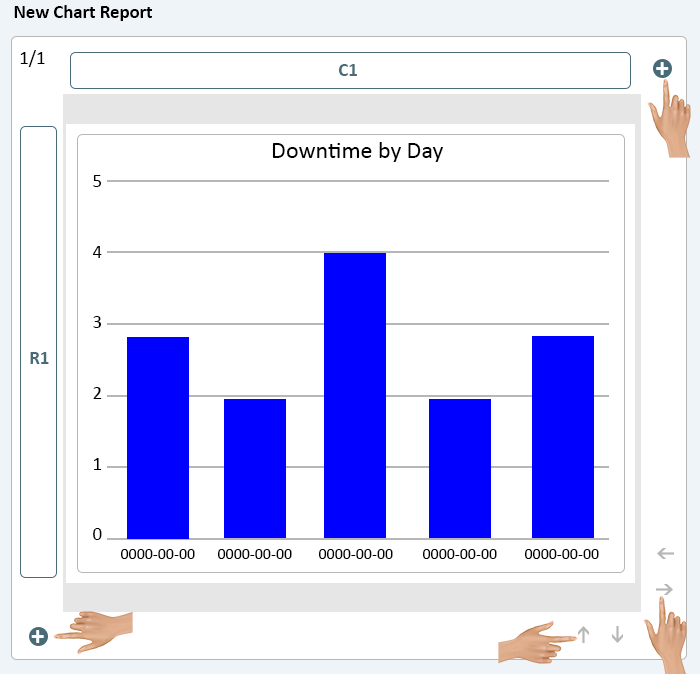
Additional Cells, Rows & Columns can be added, moved, deleted or copied to the report. Click Here for details on using this functionality.
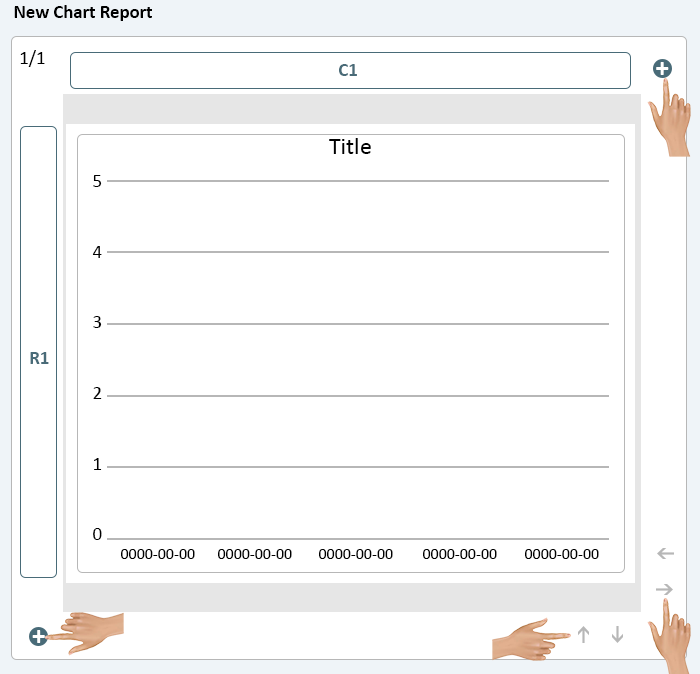
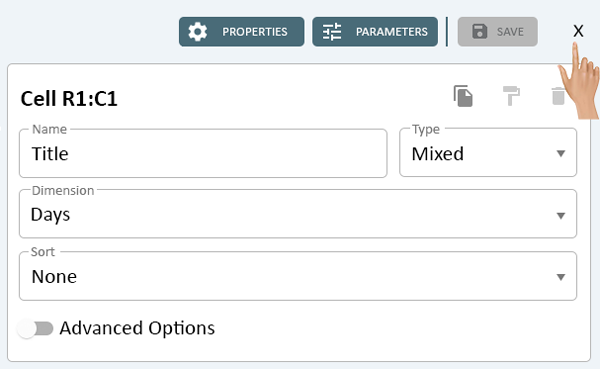
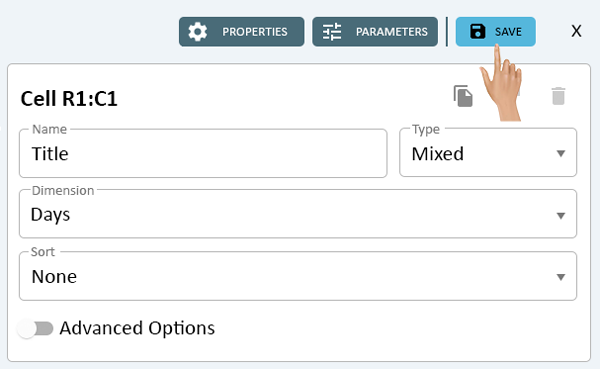
Once everything has been setup for the report, click on the Save button in the top right corner.
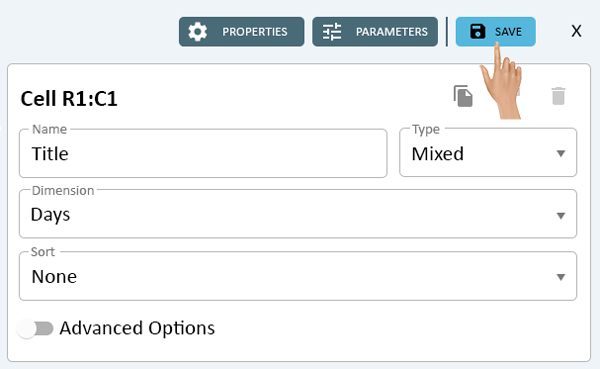
Click on the "X" next to the Save button to close the New Chart Report window.

|
|
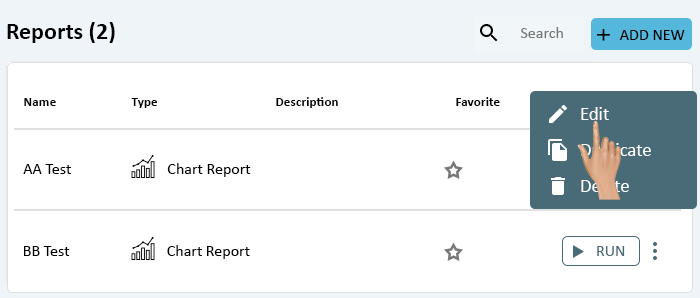
Click on the 3 dot menu icon on the right side of the reports list.
Select Edit from the pop-up menu.
Select a Report Cell that needs to be edited.
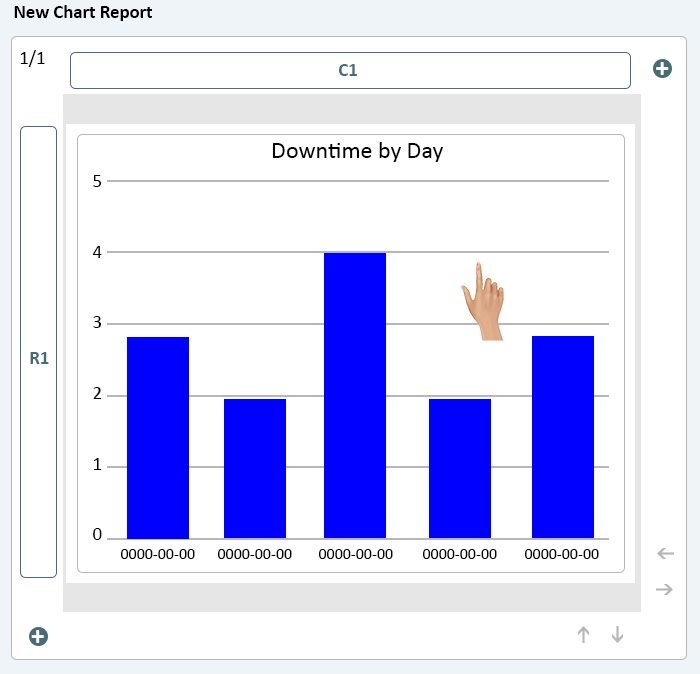
Once a Report Cell is highlighted the properties will load on the right side of the layout. There are 3 sections available for editing, select a section to edit.
- Cell Property - section at the top where the overall functionality of the cell is setup.
- Click Here for details on this section.
- Series - section in the middle that contains each data segment of the Chart/Graph. Depending on the Cell Type that is selected, there are multiple options that can be available in series.
- Mixed
- Click Here for details on the Mixed - Data Series.
- Click Here for details on the Mixed - Formula Series.
- Click Here for details on the Mixed - Moving Average Series.
- Pie Chart
- Click Here for details on the Pie Chart - Data Series.
- Click Here for details on the Pie Chart - Formula Series.
- Click Here for details on the Pie Chart - Moving Average Series.
- Dynamic - this is custom report option, please contact VersaCall support for assistance.
- Blank - when this type of cell is setup there will not be a Series option.
- Mixed
- Appearance - section at the bottom that contains the layout of the Chart/Graph when the Cell Type is Mixed or Pie Chart. There will not be any options when the Cell is setup as Dynamic or Blank. The Appearance for a Mixed Chart differs from a Pie Chart, select the appropriate link below.
- Click Here for details on a Mixed Chart/Graph Appearance.
- Click Here for details on Pie Chart Appearance.
- Cell Property - section at the top where the overall functionality of the cell is setup.

To edit the name, orientation or Description of a report, click on the Properties button at the top right side of the page.

Click in the Name or Description field and type in the new name/description.
Click on the down arrow in the Orientation field to select a different setting.
Close the Properties menu by clicking on the "X" in the top right corner of the window.
To edit a Report Parameter, click on the Parameters button in the top right corner of the page.
Parameters are used to either lock options or allow the user to select options when running a report. There are 4 sections/options in Parameters, below are links to a details page for each section/option.
Close the Parameters window by clicking on the "X" in the top right corner of the window.
- Data Filter - Click Here for details on setting up this option.
- Schedule - Click Here for details on setting up this option.
- Time Filter - Click Here for details on setting up this option.
- Date Ranges - Click Here for details on setting up this option.
Close the Parameters menu by clicking on the "X

Additional Cells, Rows & Columns can be added, moved, deleted or copied to the report. Click Here for details on using this functionality.
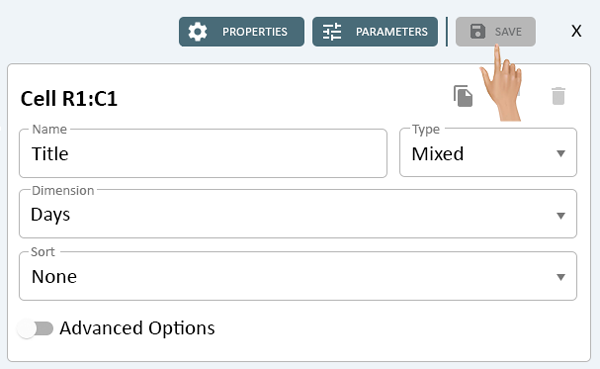
Once everything has been edited, click on the Save button in the top right corner.

Click on the "X" next to the Save button to close the Edit Chart Report window.
|
|
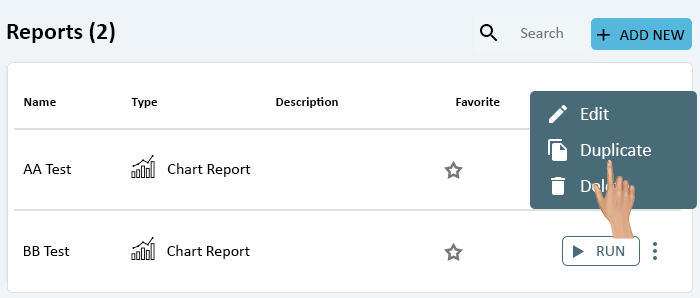
Click on the 3 dot menu icon on the right side of the reports list.

Select Duplicate from the pop-up menu.
Click on the Properties button to change the name of the report. By default, the duplicated report will be "Report Name_copy".
By default, the duplicated report will be "Report Name_copy". Click in the Name field to enter a new name for the report.
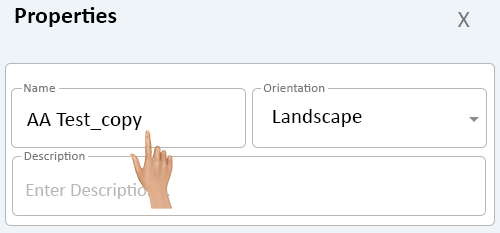
Select the down arrow in the Orientation field to change it. Click in the Description field to enter a new one.
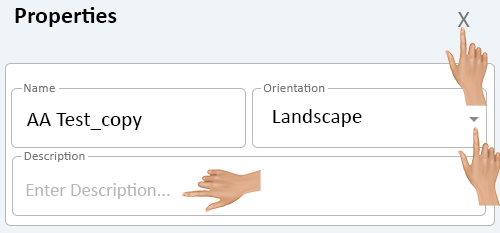
After making the changes, click on the "X" in the top right corner of the window to close the Properties menu.
Select a report cell to make changes to its setup.

Click on the Parameters button to change them.
Once all of the changes have been made, click on the Save button in the top right corner of the page.
Click on the "X" next to the Save button to close the New Chart Report window.
|
|
Click on the 3 dot menu icon on the right side of the reports list.

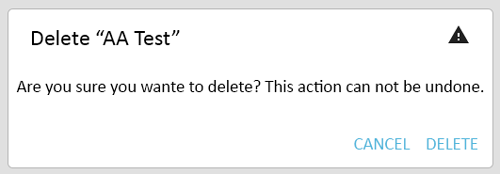
Select Delete from the pop-up menu.
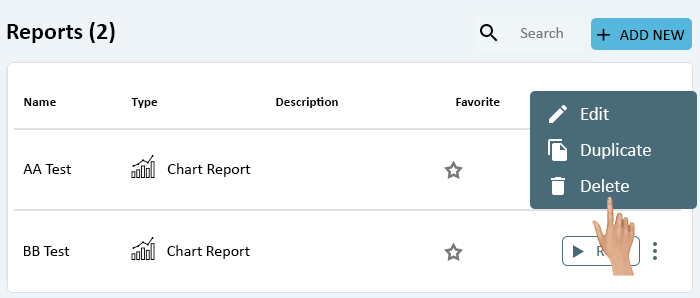
A warning message will load. Select Yes to remove the report. Select Cancel to keep the report.
|
|
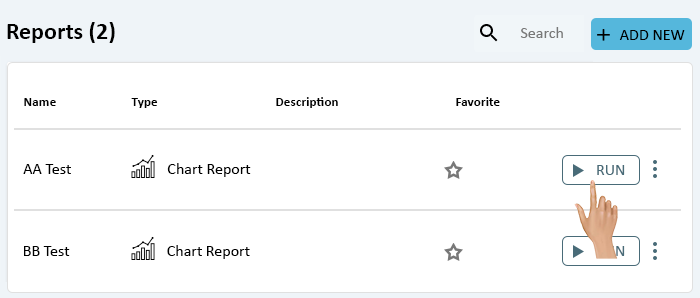
Click on the Run button on the right side of the reports list.
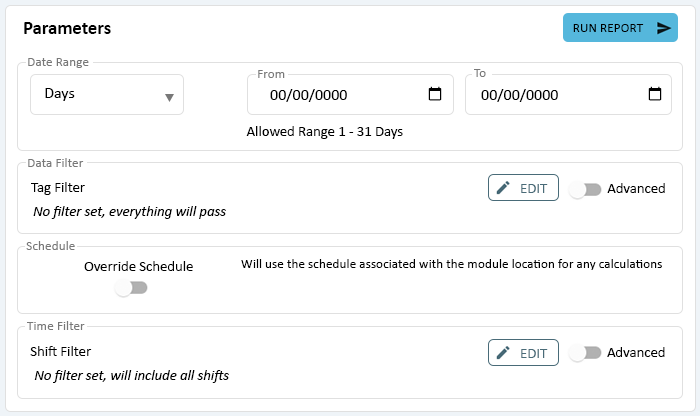
Enter the correct Parameter settings for the report.
Each report is different, there can be up to 4 different Parameters shown on any given report.
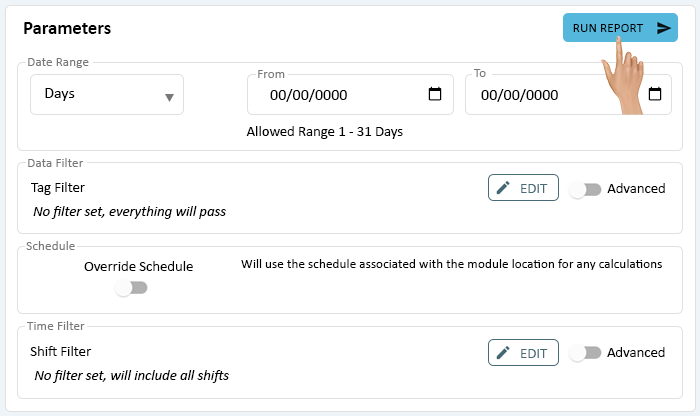
Once all the parameters are set, click on the Run Report button at the top right corner of the window.
|
|
A Report can be marked as a favorite. This will make the Report show on the VersaVision home page for faster access.
To favorite a Report, click on the Star icon on under the Favorite column
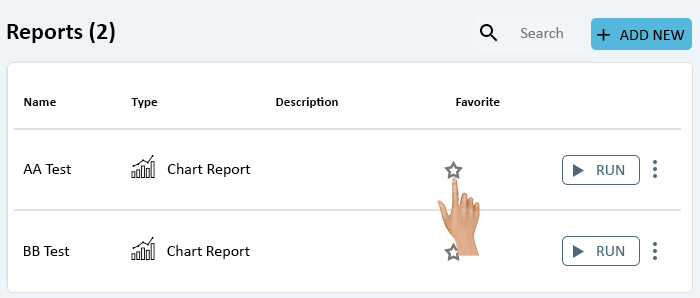
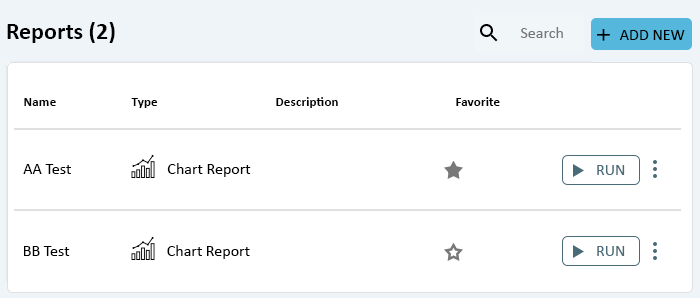
The Star will turn solid indicating that it is enabled.
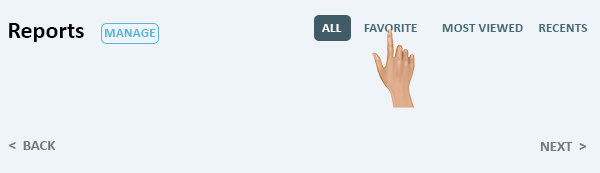
To see the result of the setting, return to the Home page.

Select the Favorite setting for the Reports section of the page.
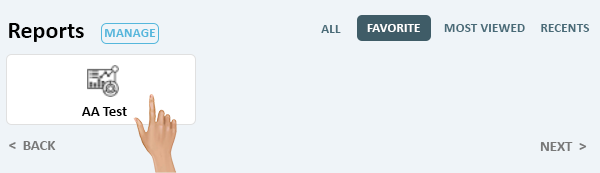
Any Report set as a favorite will show as a card under the Reports heading.
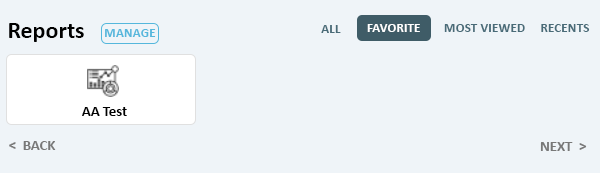
Click on the Card to run the Report from the home page.
|
|

|