Reporting - Pie Chart - Appearance
From VersaVision Support
Reporting is where the user can generate reports based on the data collected by the VersaVision software. After adding the Data Series to the Report the user can define how the legend will appear.
This page will concentrate on providing details on Selecting the Legend Position for a Pie Chart.
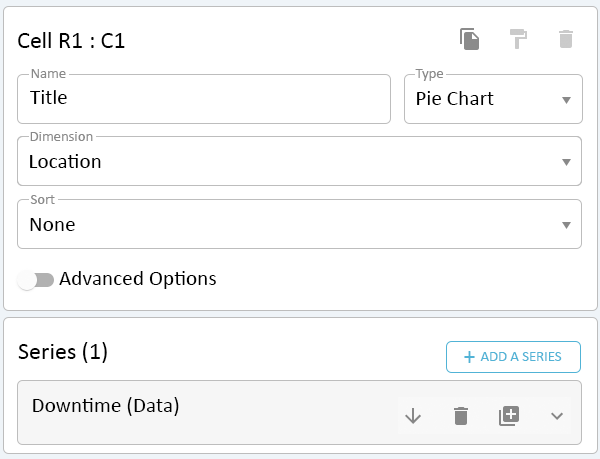
In order to utilize the Appearance feature properly the Report/Chart must have the following items:
- A Report Cell selected on the Layout.
- The Cell Type set to Pie Chart.
- One or more Data Series added to the Cell.
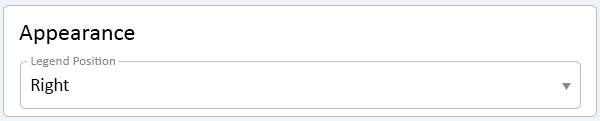
With a Cell selected scroll down to the Appearance Section on the right side. This section will show below the Series section. By default this section will be expanded.
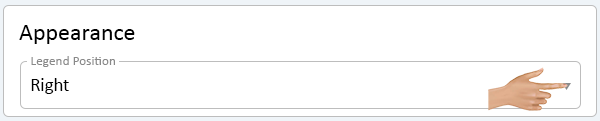
Click on the down arrow in the Legend Position field.
Select the option that best fits with the Report being created.
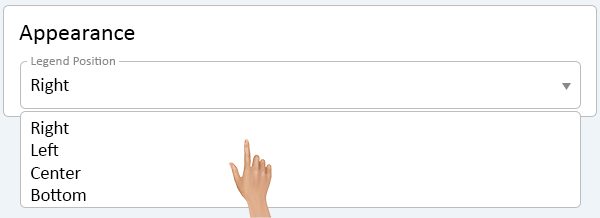
- Right - the legend will appear in the top right corner of the report.
- Left - the legend will appear in the top left corner of the report.
- Center - the legend will appear in the top center of the report.
- Bottom - the legend will appear in the bottom center of the report.
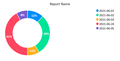
Position Right
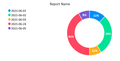
Position Left
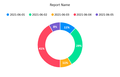
Position Top
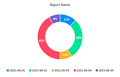
Position Bottom

|