Reporting - Mixed - Appearance
From VersaVision Support
Reporting is where the user can generate reports based on the data collected by the VersaVision software. After adding the Data Series to the Report the user can define how the legend will appear and setup name(s) for the Y Axis.
This page will concentrate on providing details on Selecting the Legend Position, Setting up the Y Axis, Adding a Y Axis, Deleting a Y Axis, Enabling the Stacked Bar Segment and Assigning a Data Series to a Y Axis.
In order to utilize the Appearance feature properly the Report/Chart must have the following items:
- A Report Cell selected on the Layout.
- The Cell Type set to Mixed.
- One or more Data Series added to the Cell.
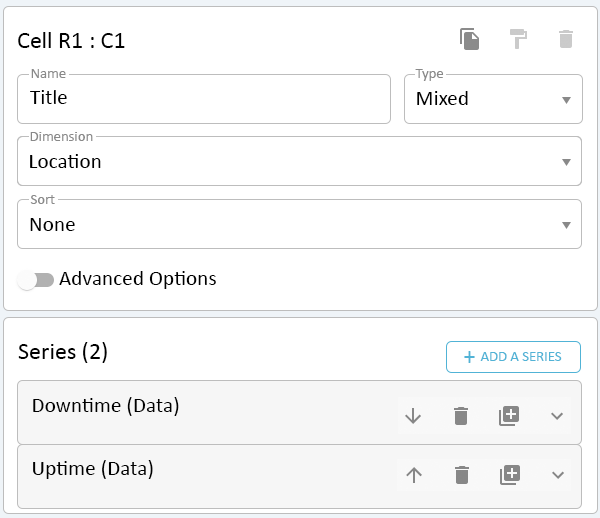
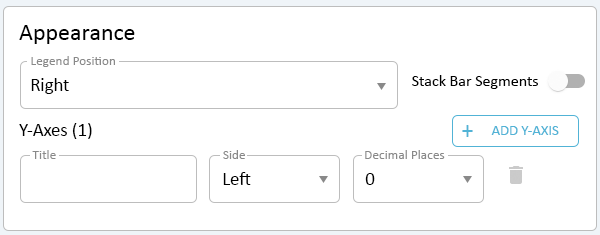
With a Cell selected scroll down to the Appearance Section on the right side. This section will show below the Series section. By default this section will be expanded.
Click on the down arrow in the Legend Position field.
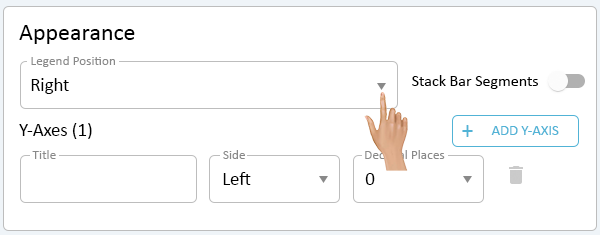
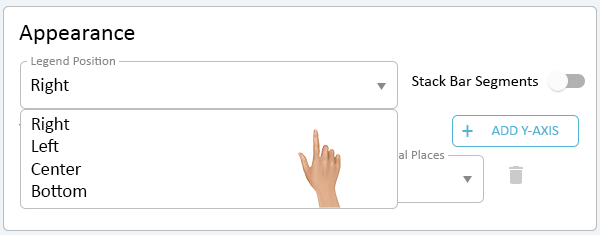
Select the option that best fits with the Report being created.
- Right - the legend will appear in the top right corner of the report.
- Left - the legend will appear in the top left corner of the report.
- Center - the legend will appear in the top center of the report.
- Bottom - the legend will appear in the bottom center of the report
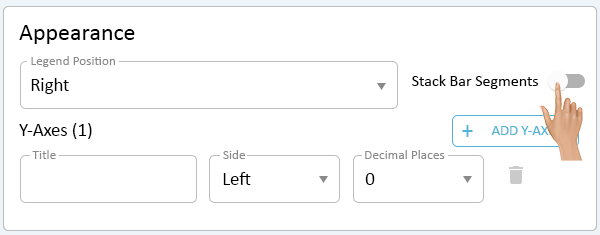
Click on the Stack Bar Segments switch to turn the function on.
This option is to be used when the report has 2 Series that are directly related to one another.
An example would be Total Uptime & Total Downtime. Using the Stack funtion would allow the user to view 1 bar showing the Uptime & Downtime together.
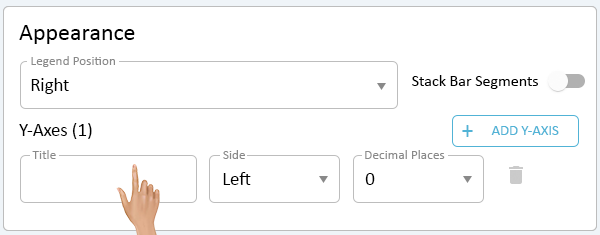
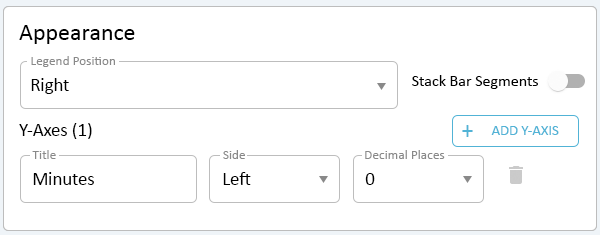
By default, there will always be 1 Y-Axis present in Appearance.
Using the Total Uptime & Total Downtime example, the report would have the Y Axis show a time segment (Seconds, Minutes or Hours).
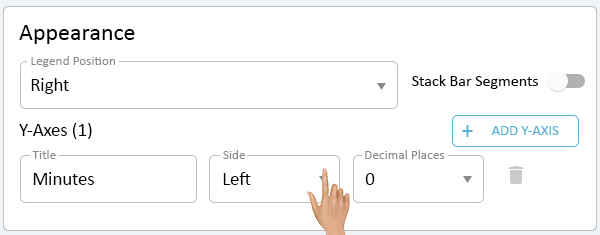
Click in the Title field and enter a name for the Y-Axis.
Click on the down arrow in the Side field to define where the Y-Axis Title should appear.
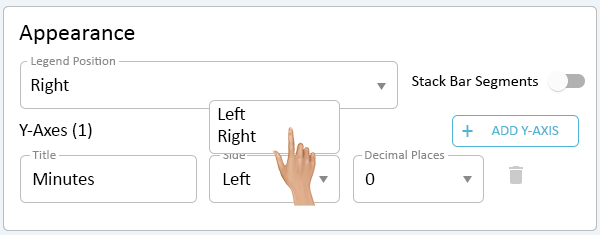
Select the appropriate position for the title.
- Left - the Title will appear on the left side of the report centered on the graph.
- Right - the Title will appear on the right side of the report centered on the graph.
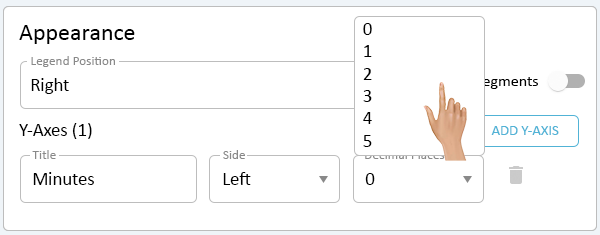
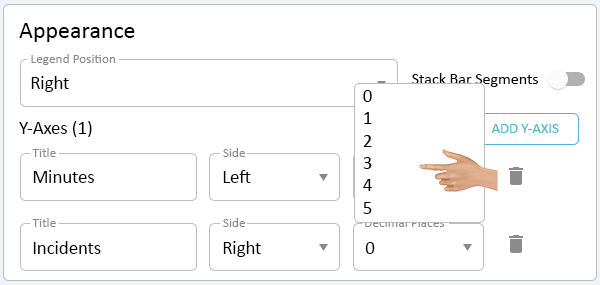
Click on the Down arrow in the Decimal Places field. This setting allows the user to show decimal places on the Y-Axis.
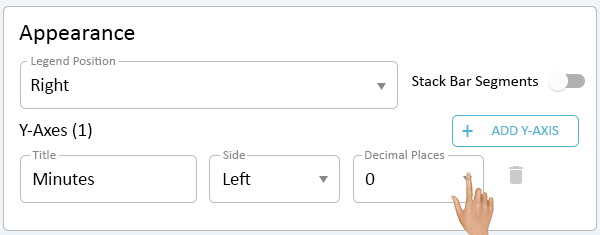
Select the appropriate number of places for the report being created.
NOTE: The decimal places generally only apply to a Formula Series.
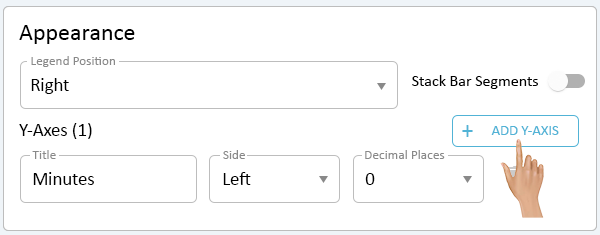
If there are multiple Series on a graph that require separate Y Axes, click on the Add Y-Axis button in the Appearance section.
Example of this need would be a graph that has Total Downtime and Number of Incidents. There would be a need for a Y-Axis for Time (Seconds, Minutes, Hours) and a Y-Axis for a Whole Number.
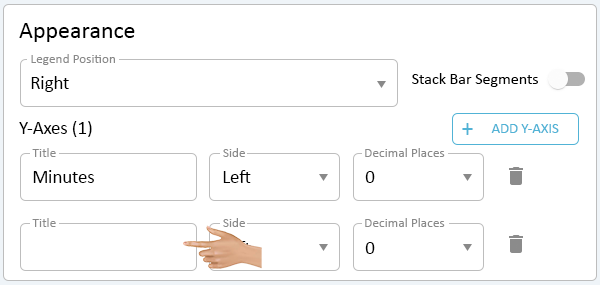
The new Y-Axis will load below the existing Y-Axis.
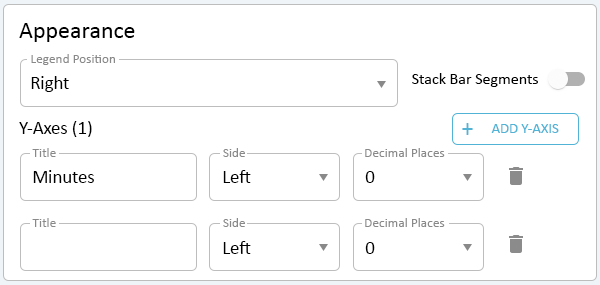
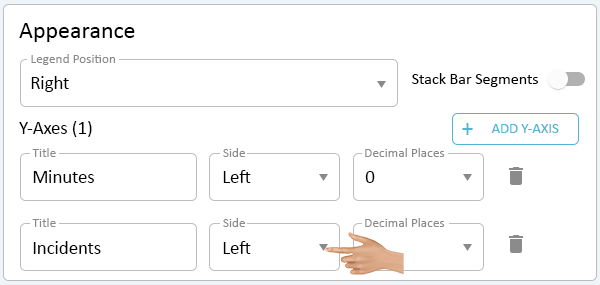
Click in the Title field and enter a name for the Y-Axis.
Click on the down arrow in the Side field to define where the Y-Axis Title should appear.
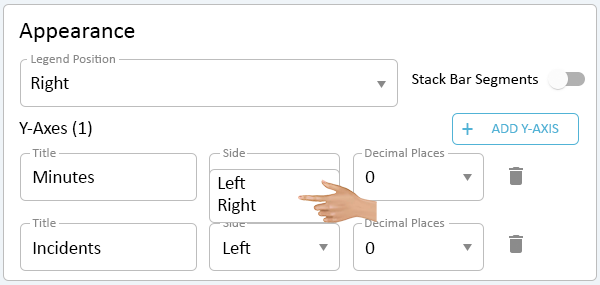
Select the appropriate position for the title.
- Left - the Title will appear on the left side of the report centered on the graph.
- Right - the Title will appear on the right side of the report centered on the graph.
Click on the Down arrow in the Decimal Places field. This setting allows the user to show decimal places on the Y-Axis.
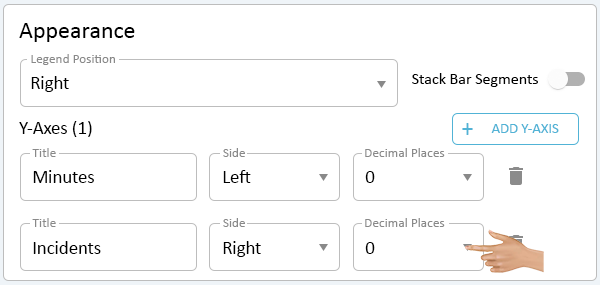
Select the appropriate number of places for the report being created.
NOTE: The decimal places generally only apply to a Formula Series.
When a report has multiple Y-Axes, the user has the ability to delete them. Click on the Delete Icon on the Axis that needs to be removed.
NOTE: A report will ALWAYS have 1 Y-Axis meaning the user can delete additional Y-Axes, but 1 of them must remain (cannot be removed).
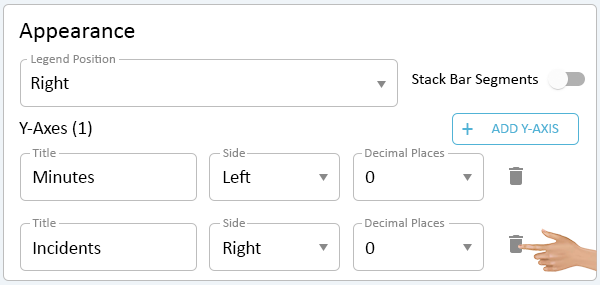
There will be no warning message, the Y-Axis will be automatically removed.
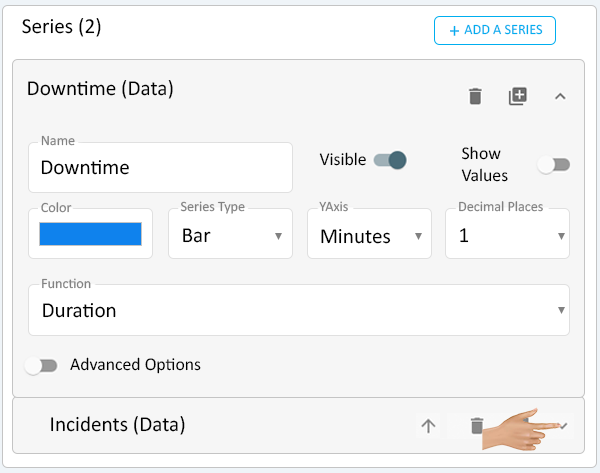
Once all of the Y-Axes have been setup, the user will need to Assign the Series to the appropriate Axis.
Using the example of Total Downtime and Total Incidents, the user would assign Total Downtime to the Minutes Axis and Total Incidents to the Incidents Axis.
Click on the expand icon for the first series that needs to be assigned.
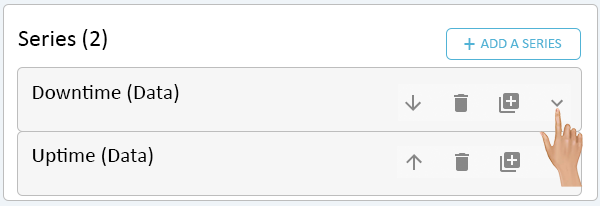
Click on the down arrow in the Y-Axis field.
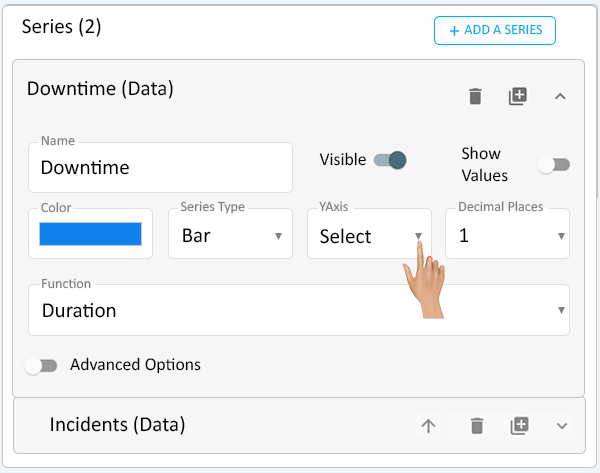
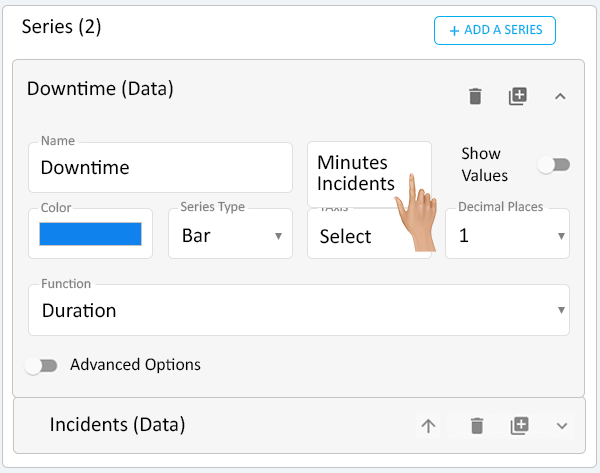
A list of all the Y-Axes created for the report will show, pick the appropriate Axis.
Repeat the process for any additional series.

|