Reporting - Report - Cell
From VersaVision Support
Reporting is where the user can generate reports based on the data collected by the VersaVision software. There are multiple components inside Reporting, this page is focused on the Cell Properties component.
The Cell Property is where the user will define the overall structure of the data in the report (Title, Type, X Axis Type, Sorting & Advanced Filtering Options).
This page will concentrate on providing details on each section contained in the Cell Properties.
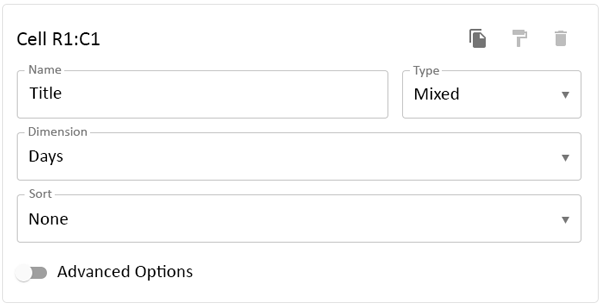
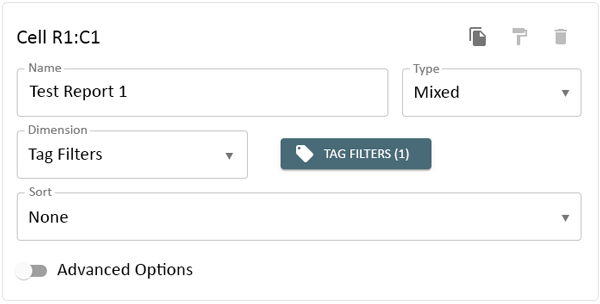
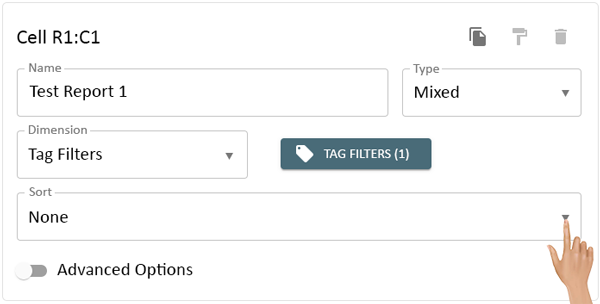
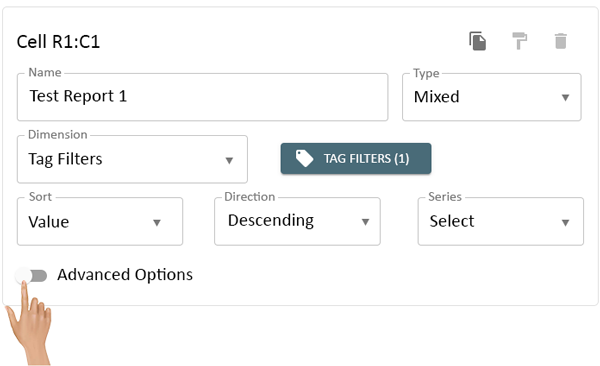
When a Report Cell has been selected on the layout, the Cell properties field will be visible on the left side of the layout.
The Heading will vary depending on what cell in the layout has been selected. It will be noted by the Column Number and Row Number.
All sections available under this heading are addressed in the information on this page.
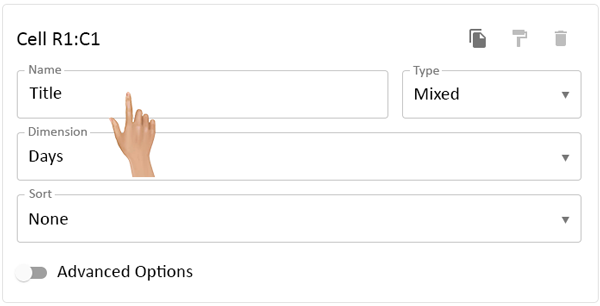
Click in the Name field to enter or edit the Title of the report.
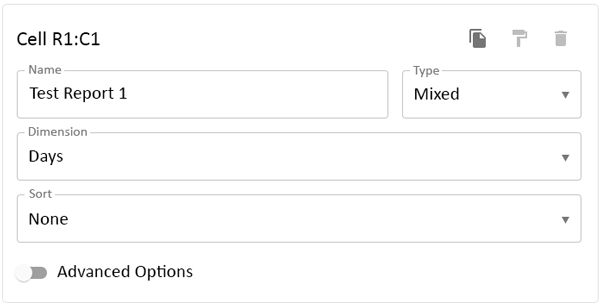
The report title will now show in the Name field.
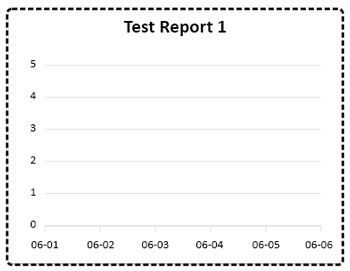
On the Report Layout, the title will show in the selected Cell.
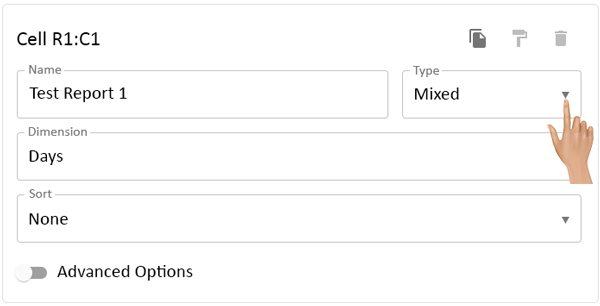
The Type field is where the user will define what type of report will be displayed in the cell.
Click on the down arrow in the Type field.
There are 3 options to select - Mixed, Pie Chart & Blank. Select the option best suited to the report needs.
- Mixed - allows the user the select multiple Bar and Line graphs.
- Pie Chart - allows the user to show a Pie graph in the cell.
- Blank - allows the user to show a blank cell on the report.
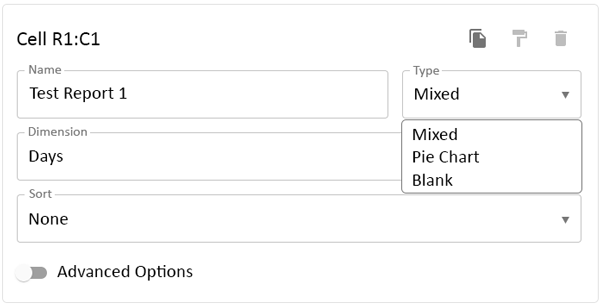
- NOTE - If Blank was selected, nothing further will need to be setup.
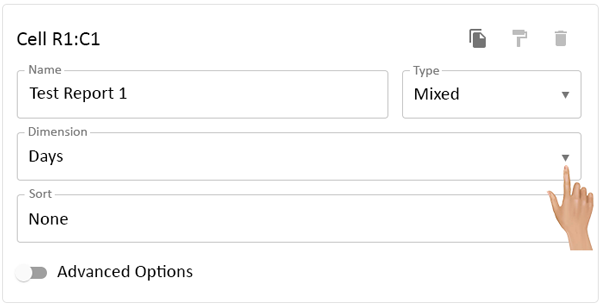
The Dimension field is where the user will define what the X Axis will represent on a Mixed report or the sections on a Pie Chart.
Select the down arrow in the Dimension field.
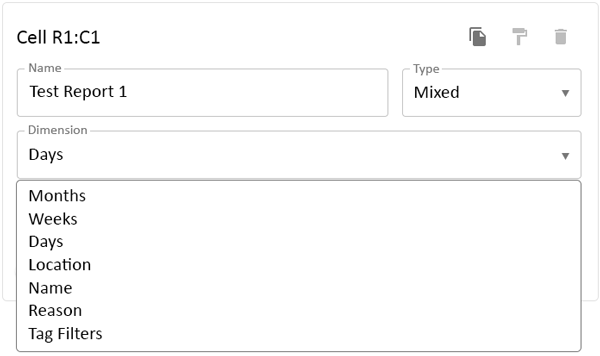
There are 7 options available. Months, Weeks, Days, Location & Name will require nothing additional from the user.
- Months - selecting this option will divide the X Axis and Pie Chart sections into months of the year.
- Weeks - selecting this option will divide the X Axis and Pie Chart sections into weeks of the year.
- Days - selecting this option will divide the X Axis and Pie Chart sections into days of the year.
- Location - selecting this option will divide the X Axis and Pie Chart sections into the location name of each device.
- Name - selecting this option will divide the X Axis and Pie Chart sections into the name of each monitoring point.
- Reason - selecting this option will divide the X Axis and Pie Chart sections into a single tag reason. See the instructions below for more information.
- Tag Filters - selecting this option will divide the X Axis and Pie Chart sections into multiple tags. See the instructions below for more information.
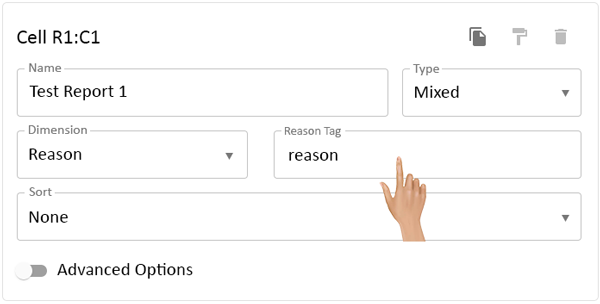
When Reason has been selected, the user will have an additional field titled Reason Tag. By default, this field will have "reason" filled in.
Click in the field to change the Reason Tag to a tag the fits the needs of the report.
An Example of a reason or reason type tag would be a list of materials that an operator can select. The user can tag all of the materials as Reason to get them to populate or give them a specific tag name.
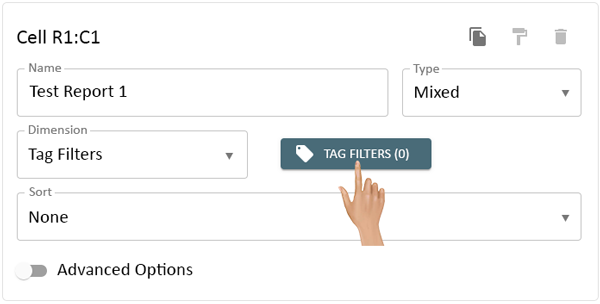
When Tag Filters has been selected, the user will have a Tag Filters Setup. The Setup allows the user to set 1 or more specific data filters that will be represented on the X Axis or Pie Chart section.
Click on the Tag Filters button to access the Setup.
An Example of a type of Tag Filter would be all of the locations in a cell with a Maintenance alert. Then the user could setup each Cell as a filter. The report would show each Cell on the X Axis or Pie Chart section.
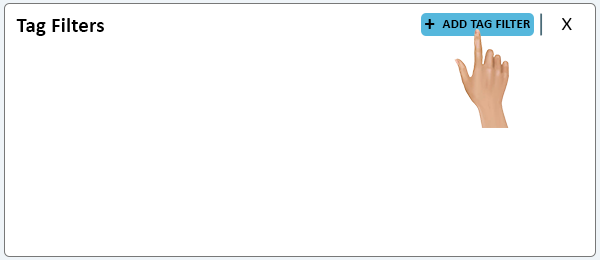
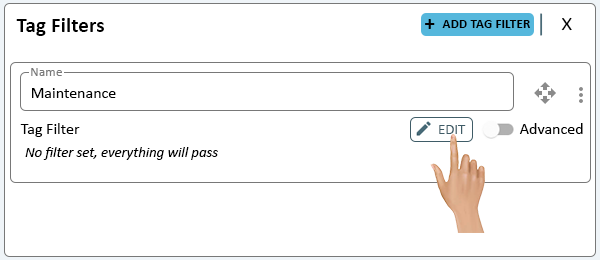
The Tag Filter Setup window will load, the list will be empty initially. Click on the Add Tag Filter button at the top of the window.
The new Filter will require a Name, click in the Name field to enter one. This Tag Name is what will be labeled on the X Axis or Pie Chart section.
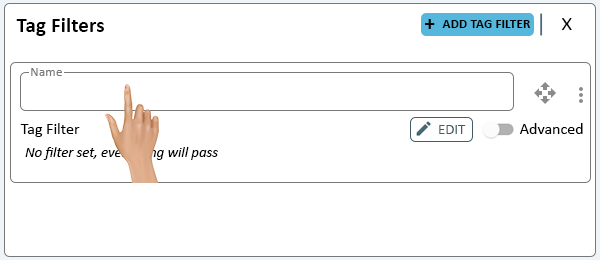
Next the user will need to indicate what tags are to used in the filter, click on the Edit button to access the Tag Filter Builder.
- Click Here for instructions on setting up a Tag Filter in the Tag Filter Builder.
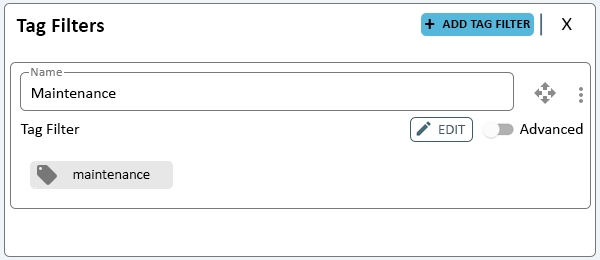
All tags that were selected in the Tag Filter Builder will show under the Tag Filter heading.
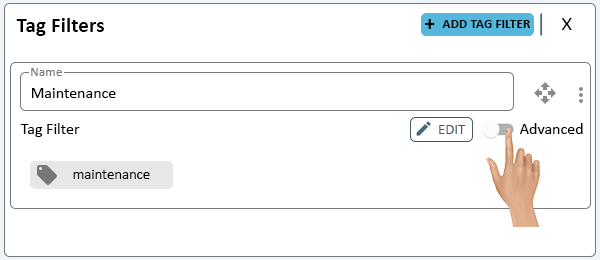
Advanced mode can be enabled by turning the toggle on.
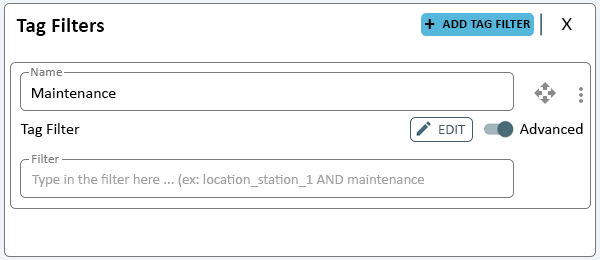
Once Advanced is enabled, an Filter field will load.
Advanced mode allows the user to type in tags and use the AND & OR commands between them. Select the Filter field to enter your tags with separators.
- AND - use this separator indicate that data is considered when an event has all the tags.
- OR - use this separator to indicate that either tag can be considered in the filter.
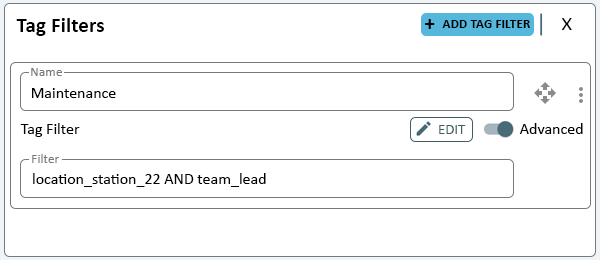
Example of a filter using the AND separator is in the image below.
Using this setup our report will only show data for events that have both the "location station 22" and "team lead" tags.
Any event that does not contain both of these tags will be omitted.
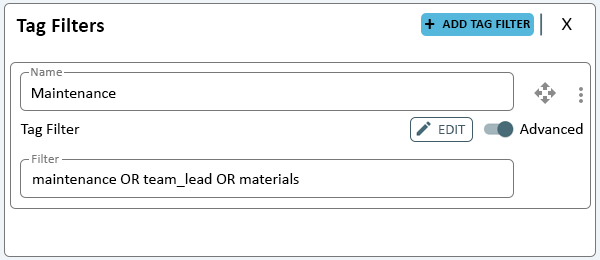
Example of a filter using the OR separator is in the image below.
Using this setup means our report will show data for any events that are tagged with "maintenance", "team lead" and "materials".
Any events NOT tagged with "maintenance", "team lead" and "materials will be omitted.
Click on the "X" next to the Add Tag Filter button to close the Tag Filter Setup window.
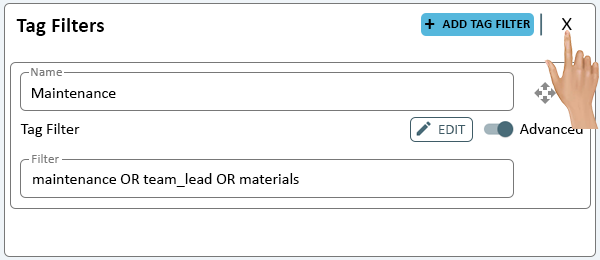
The total number of filters added will show on the Tag Filters button.
The Sort field allows the user to define how the X Axis or Pie Chart sections are organized. By default the Sort will be set to None.
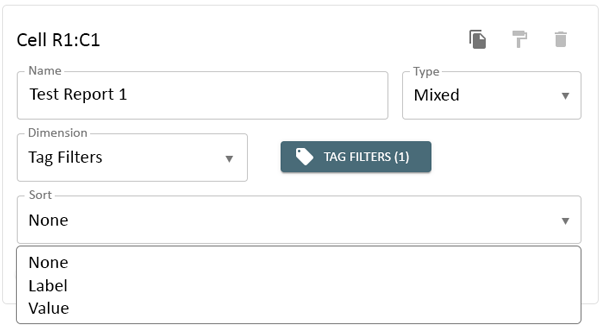
Click on the down arrow in the Sort field.
There are 3 options available - None, Label and Value. Select the best option for the report needs.
- None - selecting this option will allow the system to determine the sort.
- Label - selecting this option will allow the user to sort the chart alphabetically (Ascending or Descending).
- Value - selecting this option will allow the user to sort the chart by the value of the bar or section.
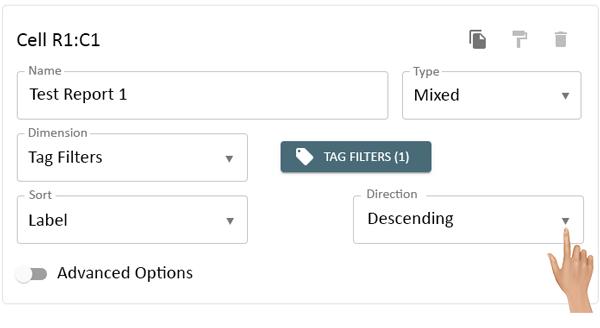
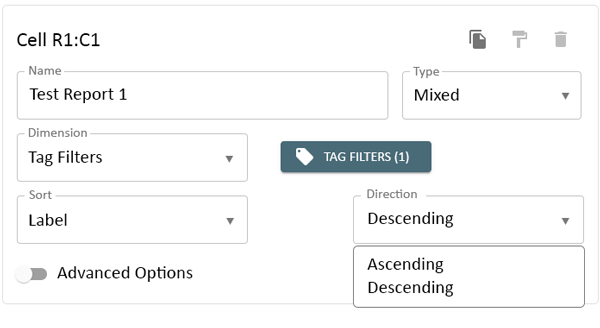
When the Label option has been selected, the user will have a Direction field available. By default this will be set to Descending. Click on the down arrow to change the setting.
The 2 options are Ascending and Descending, select the best option for the report needs.
- Ascending - select this option to sort the data labels (names) A to Z.
- Descending - select this option to sort the date labels (names) Z to A.
When the Value option has been selected, the user will have a Direction and Series fields available. Click on the down arrow in the Direction field.
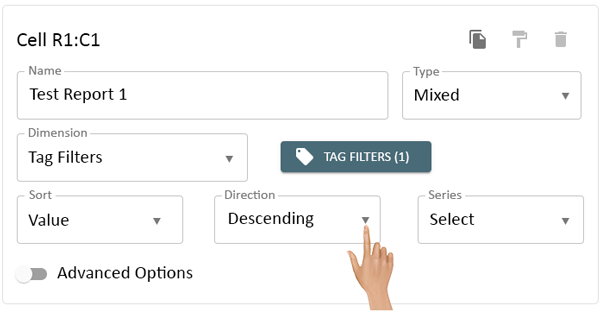
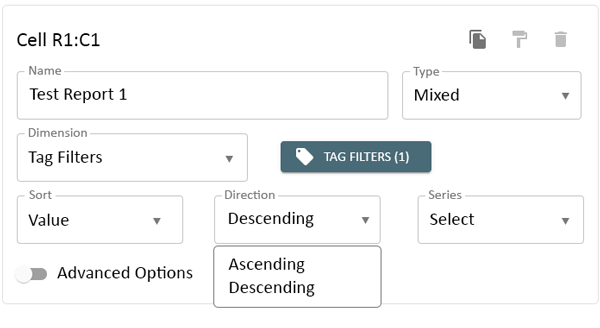
The 2 options are Ascending and Descending, select the best option for the report needs.
- Ascending - select this option to sort the value of the data (series) Low to High.
- Descending - select this option to sort the value of the data (series) High to Low.
Click on the down arrow in the Series field to select the Data series to use for sorting.
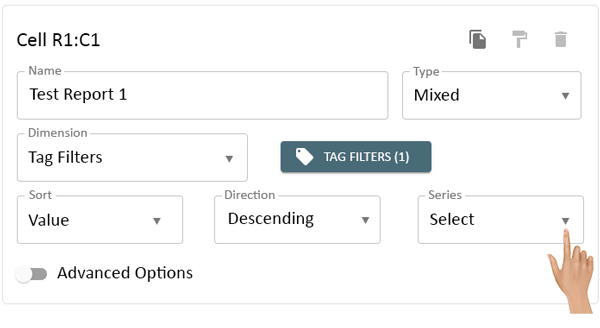
Depending on the type of report that was setup, there can be multiple data series. Select the best option for the report needs.
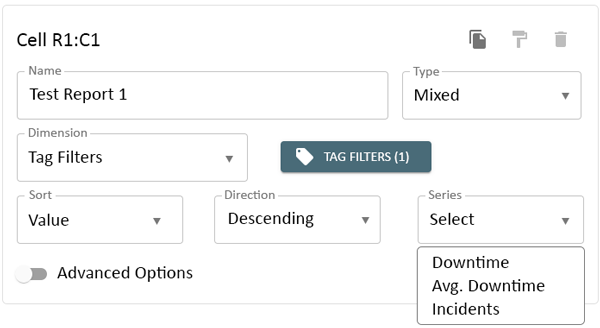
In our example (screenshot) there are 3 data series available for selection - Downtime, Avg. Downtime and Incidents.
Selecting Downtime will sort the graph by the value of the Downtime. The other series can be selected to sort by that specific element.
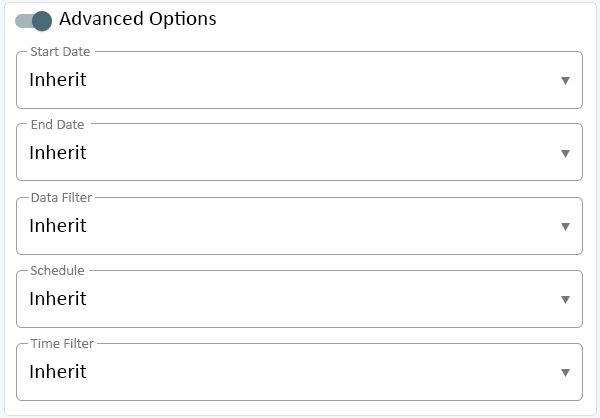
The Advanced Options can be enabled by clicking the toggle switch on.
When Advanced Options is enabled, the user will have 5 additional sections available - Start Date, End Date, Data Filter, Schedule and Time Filter.
The user would select one of this options to override the parameters that have been setup for the report.
An example of why this would be used is in a report that has multiple cells. There may be a need for one cell to use options outside of what the other cells are using.
- Click Here for details on setting up Advanced Options.

|