Reporting - Advanced Options
From VersaVision Support
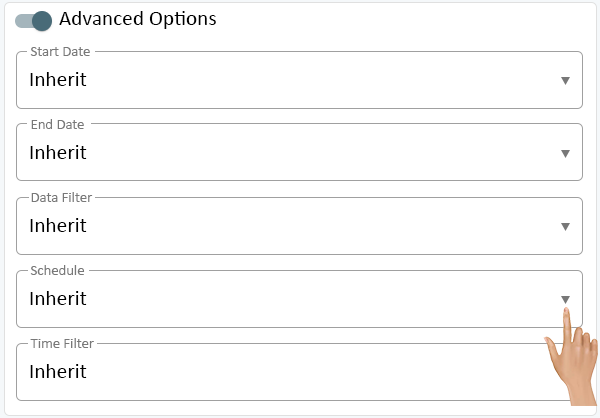
Reporting is where the user can generate reports based on the data collected by the VersaVision software. There are multiple components inside Reporting, this page is focused on the Advanced Options.
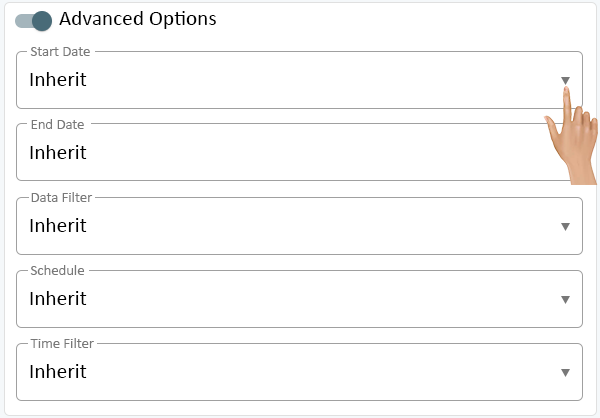
When setting up a Cell or Series, there is an Advanced Option setting. Both types have the same settings.
This page will concentrate on providing details on each section/component of the Advanced Settings.
Click on the down arrow in the Start Date field.
Select the Offset option.
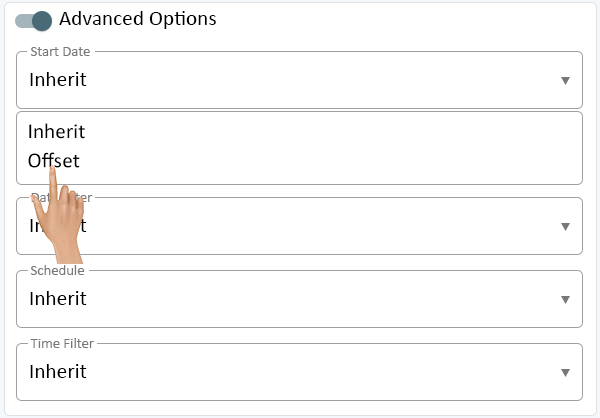
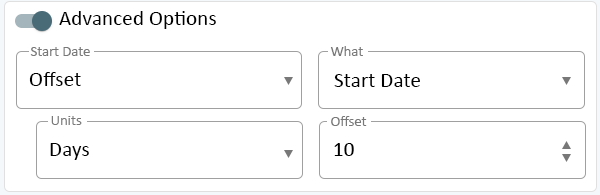
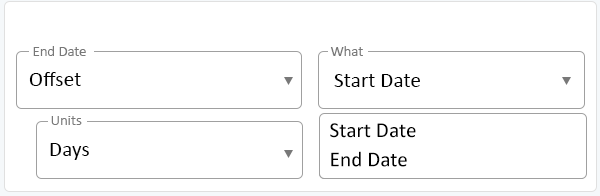
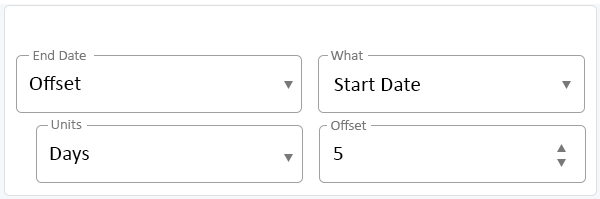
Three additional fields will load - What, Units and Offset. Click on the down arrow in the What field.
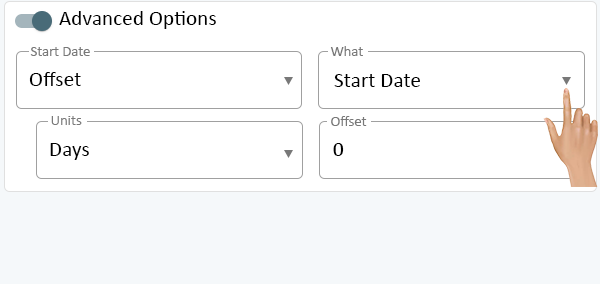
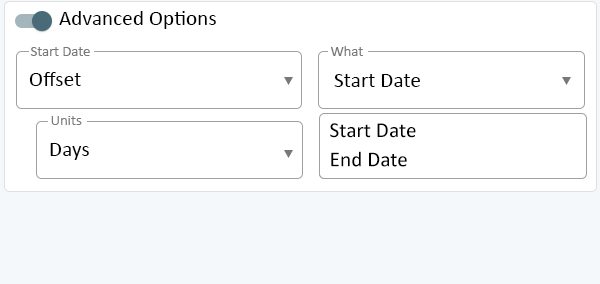
There are 2 options for this field - Start Date & End Date. Select the best option for the report needs.
- Start Date - selecting this option will allow the user to set an offset from the Start Date parameter.
- End Date - selecting this option will allow the user to set an offset from the End Date parameter.
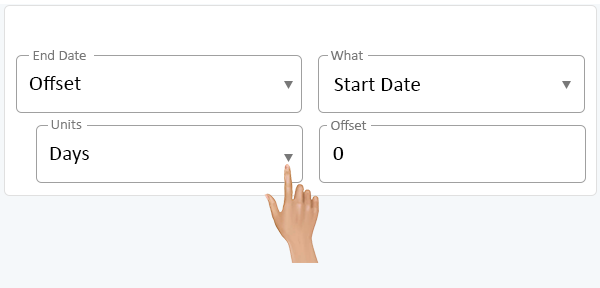
Next the offset unit/time will need to be selected. Click on the down arrow in the Units field.
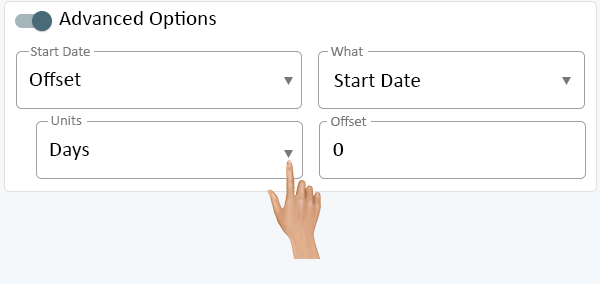
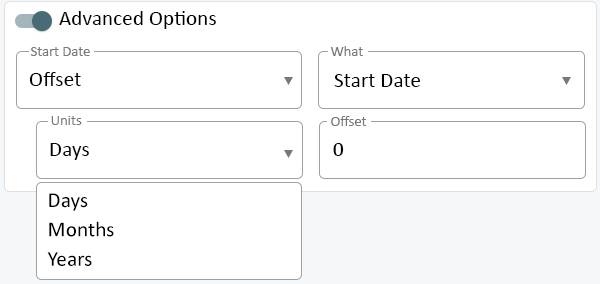
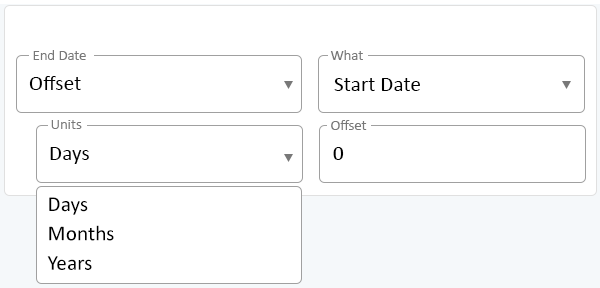
There are 3 options available - Days, Months & Years. Select the best option for the report needs.
- Days - allows the user to enter a number of days to offset the Start or End Date.
- Months - allows the user to enter a number of months to offset the Start or End Date.
- Years - allows the user to enter a number years to offset the Start or End Date.
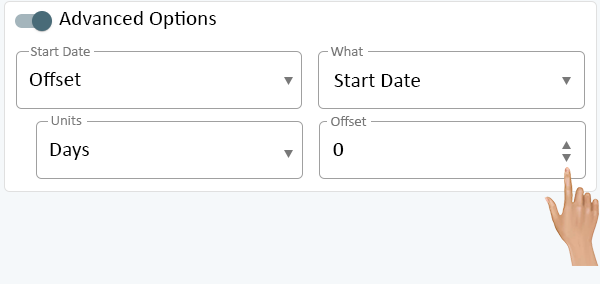
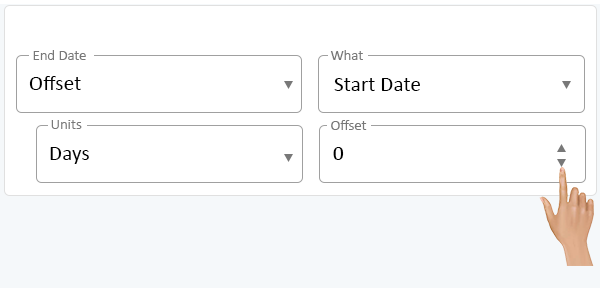
Next the Offset amount will need to be entered. Click on the Up or Down arrows in the Offset field to increase or decrease the number.
Entering a Negative number will cause the offset to go back X days from the Start or End Date.
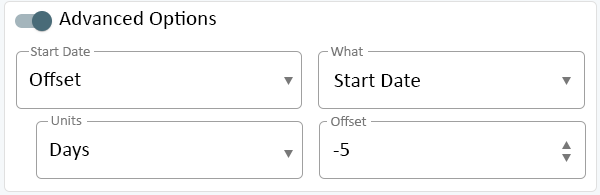
Entering a Positive number will cause the offset to go forward X days from the Start or End Date.
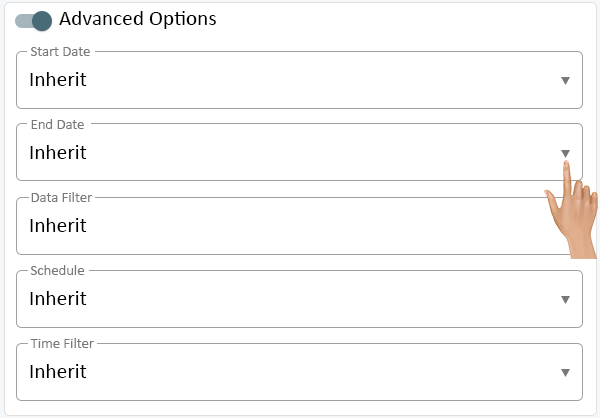
Click on the down arrow in the End Date field.
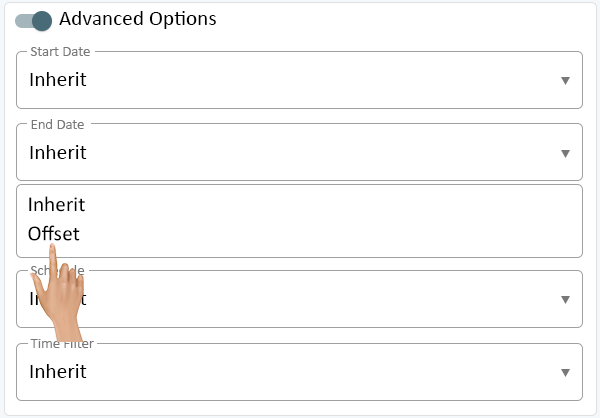
Select the Offset option.
Three additional fields will load - What, Units and Offset. Click on the down arrow in the What field.
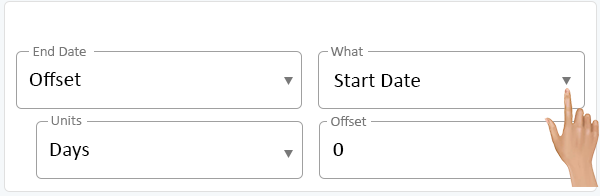
There are 2 options for this field - Start Date & End Date. Select the best option for the report needs.
- Start Date - selecting this option will allow the user to set an offset from the Start Date parameter.
- End Date - selecting this option will allow the user to set an offset from the End Date parameter.
Next the offset unit/time will need to be selected. Click on the down arrow in the Units field.
There are 3 options available - Days, Months & Years. Select the best option for the report needs.
- Days - allows the user to enter a number of days to offset the Start or End Date.
- Months - allows the user to enter a number of months to offset the Start or End Date.
- Years - allows the user to enter a number years to offset the Start or End Date.
Next the Offset amount will need to be entered. Click on the Up or Down arrows in the Offset field to increase or decrease the number.
Entering a Negative number will cause the offset to go back X days from the Start or End Date.

Entering a Positive number will cause the offset to go forward X days from the Start or End Date.
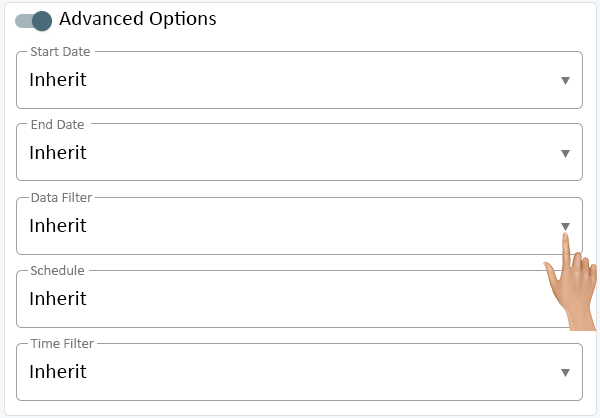
Click on the down arrow in the Data Filter field. Inherit will be selected by default.
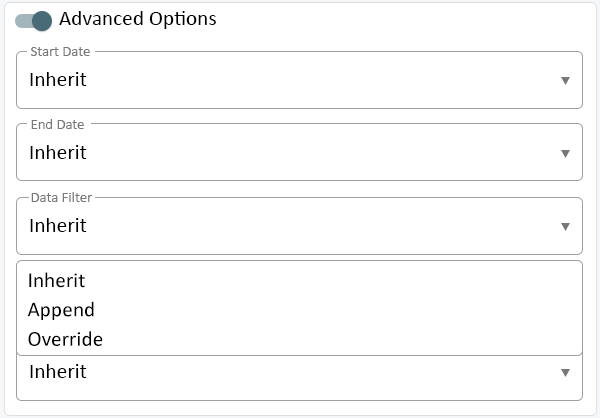
There will be 3 options available - Inherit, Append & Override. Select the best option for the report cell needs.
- Inherit - selecting this option will allow the report cell to use the Data Filter parameters already setup.
- Append - selecting this option allows the report cell to add Data to the Data Filter parameter already setup.
- Override - selecting this option allows the user to specify what data is to be used in the report cell.
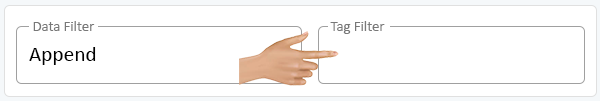
When Append is selected, an additional Tag Filter field will be shown. Select this field and type in the tag that should be used.
The Tag Advanced mode allows the user to type in tags and use the AND & OR commands between them.
- AND - use this separator to indicate that data is considered when an event has all the tags entered.
- OR - use this separator to indicate that either of the tag(s) entered can be considered in the filter.
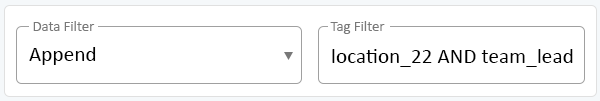
Example of a filter using the AND separator is in the image below.
Using this setup our report cell will only show data for events that have both the "location 22" and "team lead" tags.
Any event that does not contain both of these tags will be omitted.
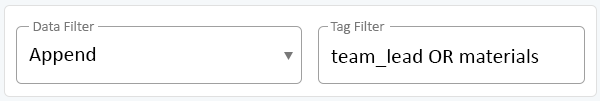
Example of a filter using the OR separator is in the image below.
Using this setup means our report cell will show data for any events that are tagged with "team lead" and "materials".
Any events NOT tagged with "maintenance", "team lead" and "materials will be omitted.
When Override is selected the user will be able to access the Tag Filter Builder. Click on the Edit button to access the Builder.
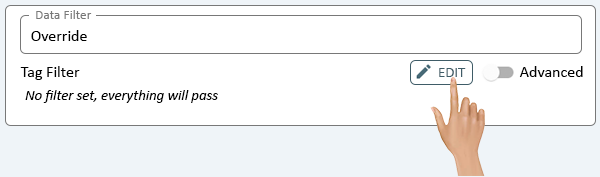
- Click Here for details on using the Tag Filter Builder.
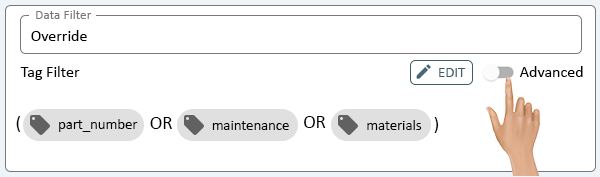
All of the filters selected in the Tag Filter Builder will show under the Tag Filter heading.
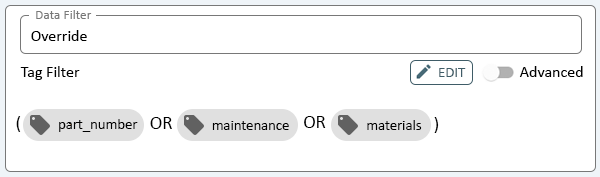
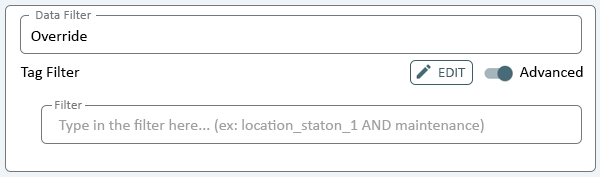
The Advanced mode can be enabled by turning the toggle on.
The Tag Filter Advanced mode allows the user to type in monitoring point & location tags. This filter can be refined using the AND & OR commands between them. Click in the field to setup the filter.
- AND - use this separator to indicate that data is considered when an event has all the tags entered.
- OR - use this separator to indicate that either of the tag(s) entered can be considered in the filter.
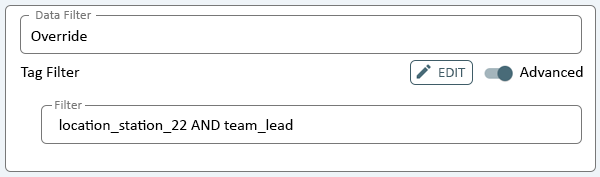
Example of a filter using the AND separator is in the image below.
Using this setup our report will only show data for events that have both the "station 22" and "team lead" tags.
Any event that does not contain both of these tags will be omitted.
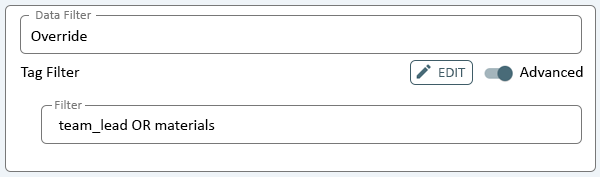
Example of a filter using the OR separator is in the image below.
Using this setup means our report will show data for any events that are tagged with "team lead" and "materials".
Any events NOT tagged with "team lead" and "materials will be omitted.
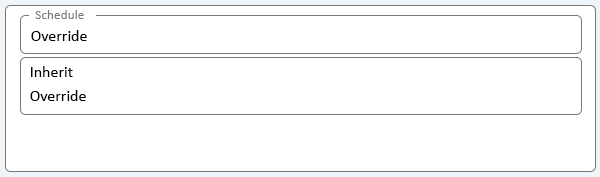
The Schedule field allows the user to override the Schedule setup in the Schedule parameter. Click on the down arrow in the Schedule field.
There are 2 options available - Inherit and Override. Select the best option for the report cell.
- Inherit - selecting this option will allow the report cell to use the Schedule Filter parameters already setup.
- Override - selecting this option allows the user to specify what Schedule is to be used in the report cell.
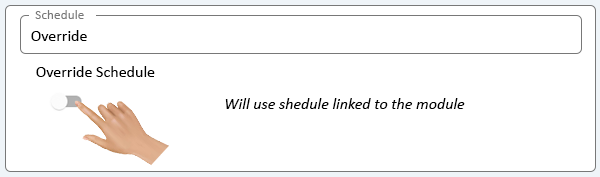
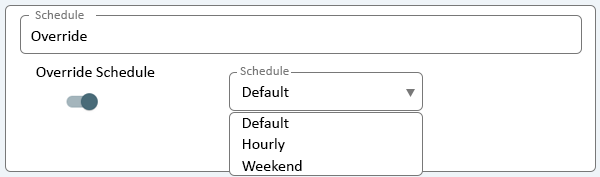
When Override is selected the user will have a toggle switch available. Turn the toggle on to enable the Override
A Schedule field will show next to the toggle switch. Click on the down arrow in this field.
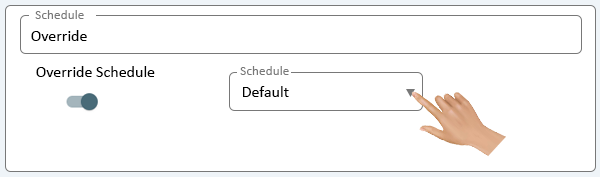
This list will populate with all of the Schedules that have been setup on the system. Select the appropriate Schedule for the report cell.
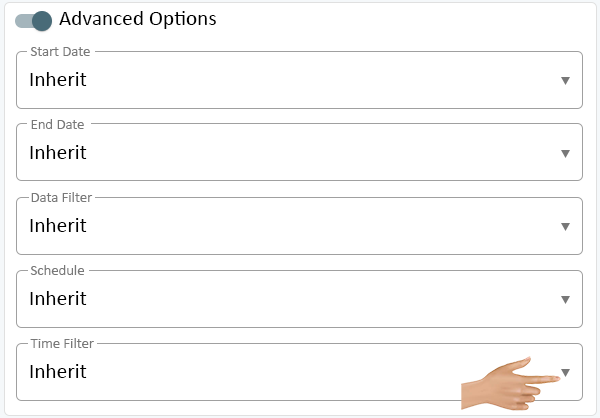
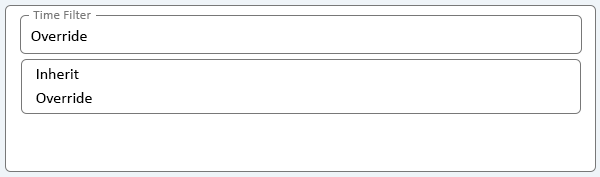
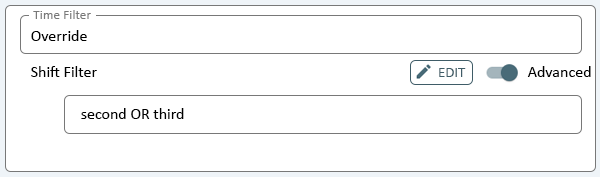
The Time Filter field allows the user to override the Shift(s) setup in the Time Filter parameter. Click on the down arrow in the Time Filter field.
There are 2 options available - Inherit and Override. Select the best option for the report cell.
- Inherit - selecting this option will allow the report cell to use the Schedule Filter parameters already setup.
- Override - selecting this option allows the user to specify what Schedule is to be used in the report cell.
When Override is selected the user will have a Shift Filter option. Click on the Edit button to access the Shift Filter Builder.
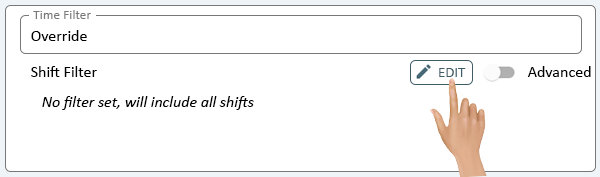
- Click Here for details on using the Shift Filter Builder.
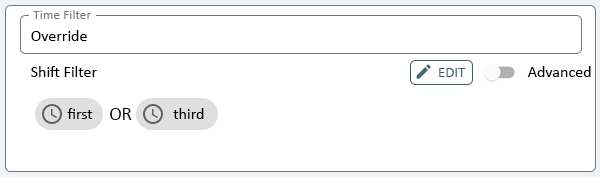
The Shift Filters that were selected in the Shift Filter Builder will show under the Shift Filter heading.
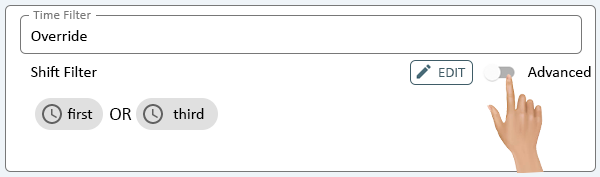
The Advanced mode can be enabled by clicking on the Advance toggle switch.
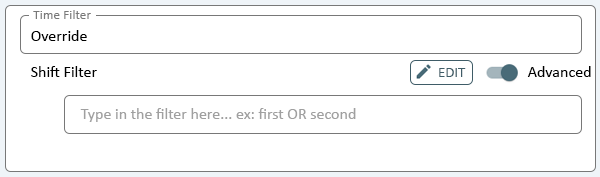
The Shift Filter Advanced mode allows the user to type in shift tags and use the AND & OR commands between them. Click in the field to setup the filter.
- AND - use this separator to indicate that data is considered when an event has all the shift tags entered.
- OR - use this separator to indicate that either of the shift tag(s) entered can be considered in the filter.
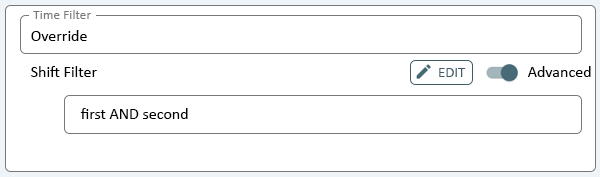
Example of a filter using the AND separator is in the image below.
Using this setup our report will only show data for events that have both the "first" and "second" shift tags.
Any event that only happened on first shift will be omitted and vice versa. The event must have occurred on both 1st & 2nd Shifts.
Example of a filter using the OR separator is in the image below.
Using this setup means our report will show data for any events that are tagged with "second" or "third" shift tags.
Any events NOT tagged with "first" will be omitted.

|